How to change the way your run is displayed


Introduction

There are a number of ways to change the way your method run data is displayed in the System Control module. This section describes a few of the options.


How to edit the pane displays

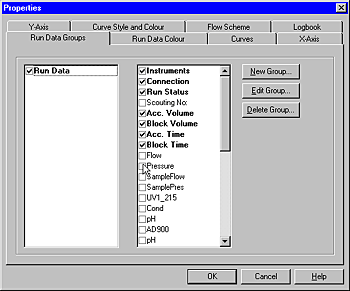
The table below describes how to open the Properties dialog box to edit the way the panes are displayed.

Step

Action

1

Right-click in the pane you want to edit.

2

Select Properties from the menu.

3

Click the tab for the pane you want to edit.

Result: The page shows all the options that you can select in this particular pane. You also have a choice of different styles, colors and axis layouts for your curves.


How to change the Y-axis scale display

You can select which curve the Y-axis scale refers to in two different ways:

  • Click the curve name at the top of the Curve Data pane.

or

  • Click the Y-axis scale to toggle between the curve scales.


How to set fixed values for the Y-axis

The table below describes how to set a fixed value range for the Y-axis for a selected curve in the Properties dialog box.

Step

Action

1

Click the Y-axis tab.

2

Click the curve you want to edit.

3

Click the Fixed radio button.

4

Type a minimum and a maximum value. The maximum range values allowed are shown above the entry boxes.

5

Repeat steps 2 to 4 for all other curves you want to edit.

6

Click OK.


2005-06-15