How to perform a basic peak integration


Introduction

Peak integration is used to identify and measure curve characteristics, including peak areas, retention times and peak widths.


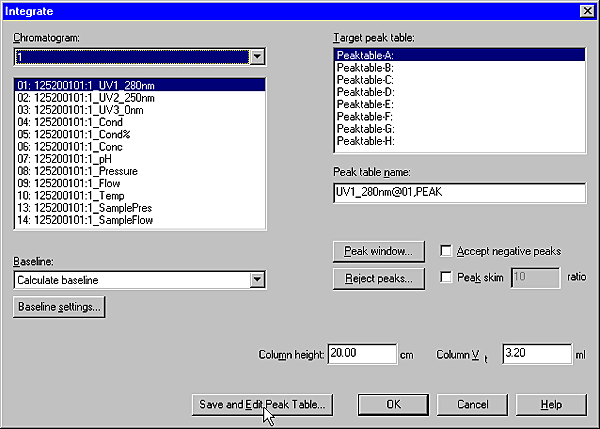
Baseline calculations

A correct baseline must be calculated before the peak areas can be calculated. There are several alternative ways to perform this calculation:

  • use automatic calculation,

  • subtract a blank run curve from the source curve,

  • use a Zero baseline, i.e. no baseline subtraction at all,

  • re-use an existing baseline,

  • edit a baseline manually from any curve in the chromatogram.

The default options are used for the example in this section, i.e. automatic calculation (Calculate baseline) with a Morphological algorithm.


How to perform the peak integration

The table below describes how to perform a basic peak integration.

Step

Action

1

  • Select the Integrate:Peak Integrate menu command.

or

  • Click the Peak Integrate icon.

Result: The Integrate dialog box opens.

2

Select a source curve.

3

Select a peak table destination from the Target peak table list.

4

Select Calculate baseline in the Baseline list.

5

Click OK.


The Integrate dialog box

This is an illustration of the Integrate dialog box.


Peak integration results

This is an illustration of the results after a peak integration.

Note: The peak table is displayed underneath the active chromatogram. The start point and end point of each peak are marked by vertical marks, drop-lines.


How to display peak characteristics

The peaks in the integrated chromatogram are automatically labelled with their retention times. Several other peak characteristics are also calculated automatically. The table below describes how to display other characteristics.

Step

Action

1

Right-click in the active chromatogram.

2

Select Properties.

Result: The Chromatogram Layout dialog box opens.

3

Click the Peak Table tab.

4

Select the options that you want to display from the Select peak table columns list.

Result: The selected items will be displayed in the peak table.

5

Click OK.


The Peak Table dialog box

This is an illustration of the Peak Table dialog box.


2005-06-15