How to view and edit your result layout


Introduction

This section describes the basics of how to view and edit the layout of your results in the Evaluation module.


How to open the result file

The table below describes how to view the results.

Step

Action

1

Complete the method run.

2

Locate the result file in the Results pane in the UNICORN Manager module.

3

Double-click the file.

Result: The file opens in the Evaluation module.


The Raw Chromatogram Data

The result file is opened in a Chromatogram window. The default view shows all the curves as in the illustration below.


How to change the chromatogram layout

The table below describes how to change the layout of the Chromatogram display.

Step

Action

1

Right-click in the Chromatogram window and select Properties.

Result: The Chromatogram Layout dialog box opens.

2

Click the Curve tab.

3

Click the check-boxes to de-select the curves that you do not want to display.

4

Click OK.


Raw data curves are saved

Your selections determine the curves that are displayed in the Chromatogram window and shown on printouts.

Note: The original raw data curves can never be modified, renamed or deleted from the result file.


How to change the Y-axis scale

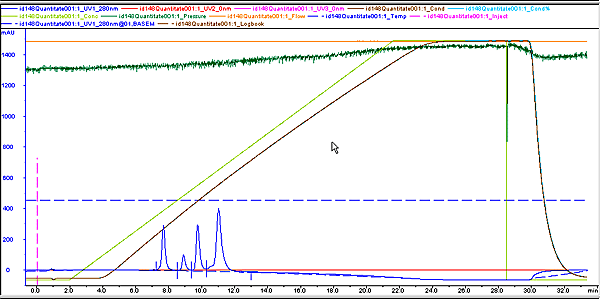
Normally the curves are auto scaled, i.e. the highest and lowest values for each curve set the scale. The table below describes how to change auto scaled Y-axis scales to fixed values in the Chromatogram Layout dialog box.

Step

Action

1

Click the Y-axis tab.

2

Click the curve you want to edit.

3

Click the Fixed radio button.

4

Enter new minimum and maximum values.

5

Repeat steps 2 to 4 for all other curves you want to edit.

6

Click OK to execute the changes and close the window.


How to change the Y-axis scale display

You can select which curve the Y-axis scale refers to in two different ways:

  • Click the curve name at the top of the Curve Data window.

or

  • Click the Y-axis scale to toggle between the curve scales.


How to view curve details

The table below describes how you can zoom in on a curve to view more details.

Step

Action

1

Place your cursor in a corner of the area you want to enlarge.

2

Press and hold the left mouse button and drag diagonally over the area.

Result: A rectangle appears.

3

Release the mouse button.

Result: The area within the rectangle is enlarged.

4

Repeat steps 1 - 3 to enlarge the selected area further.

5

Right-click and select Undo Zoom to zoom out one step.

6

Right-click and select Reset Zoom to return to the full window view.


How to save a layout

You can save your edited layout. It can be applied later to any result file. Follow the steps in the table below.

Step

Action

1

Right-click and select Properties to open the Chromatogram layout dialog box.

2

Select the Layout library tab.

3

Click the Save current layout as... button.

4

Enter a name for the layout and click OK.


How to apply a saved layout

Select a layout from the Saved layouts list in the Layout library. Click the Apply selected layout button.


2005-06-15