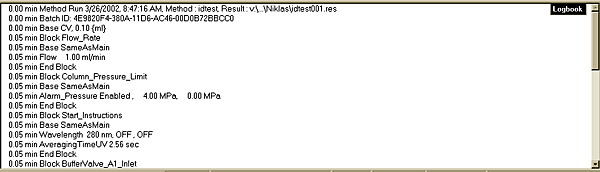
The System Control module


Introduction

All data on your separation run are displayed in the System Control module. You have a choice of four different panes that can be open one at a time or all at once in separate parts of the window.


How to select displays

The table below describes how to select the panes that are displayed in the System Control module.

Step

Action

1

  • Select the View:Panes menu command.

or

  • Click the Customise Panes icon.

2

Click the check boxes for the panes that you want to display.

3

Click OK.


The Run Data pane

The Run Data pane shows the current values for the running parameters. When the system is running, the text Run is displayed in the Run Status panel. If the system is operated manually the text Manual is displayed. The illustration below shows only part of the Run Data pane.


The Curve Data pane

The Curve Data pane shows selected monitor signals as curves during your method run. All curves are stored in the result file. Normally the curves are scaled with auto scaling, i.e. the scale is adjusted continually to the highest and lowest values for each curve.


The Flow Scheme pane

The Flow Scheme pane shows a schematic view of your system configuration.


The Logbook pane

The Logbook pane is shown at the bottom. The Logbook shows exactly when the instructions in the method were executed during the run. It also shows all manual instructions that were performed and all alarms and warnings that were registered.


How to view a single pane

If you want....

then....

to enlarge a pane

right-click and select Maximize.

to return to the original size

right-click and select Restore.


2005-06-15