|
The
table below describes the features of the Quadratic curve
fit model:
|
Feature
|
Description
|
|
Equation.
|
y = Ax2 + Bx + C
|
|
Mathematical model.
|
The constants A, B and C are determined by linear least
squares regression.
|
|
Minimum number of required points.
|
3 (at least 6 points recommended)
|
|
Measuring range for the calibration curve.
|
Within the highest and lowest values for the points.
|
Note: A variant
of this model is available for the production of a molecular size curve.
This uses the logarithm of the molecular size as the x value in
the expression above.
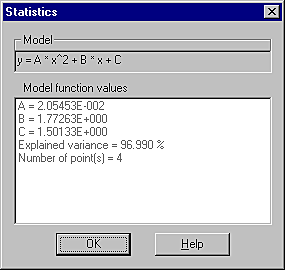
The illustration below is an example of the statistical information
for an applied Quadratic curve
model:
|