General information about quantitation


Introduction

This section is a brief presentation of the quantitation techniques that the Analysis module provides. The section also contains an outline of the steps in a quantitation and the procedure instructions for quantitation that are added when the Analysis module is installed.


About quantitation

Most 
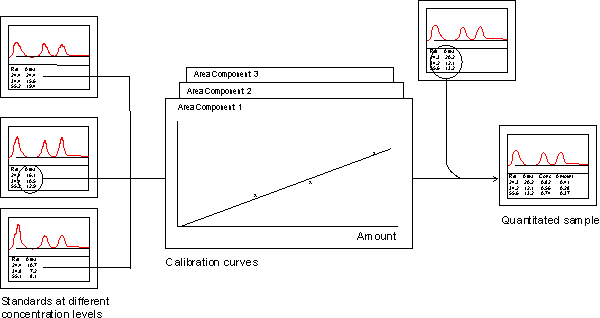
quantitation techniques use peak integration data from standards to produce calibration curves. These curves show the relationship between the amount of the components of interest and the peak sizes at different concentration levels of the standard. The relationship can be linear, quadratic or point-to-point. Quantitation is usually based on a number of test runs using a standard at several concentration levels.

The amount and concentration of the component(s) of interest in the sample are then determined from the peak size of the component using the calibration curve.

Note: Quantitation should only be performed on chromatograms that have been integrated and saved. Time is the recommended base unit for quantitation and it must be used for all integrations.


Quantitation steps

The table below describes the general steps in quantitation. The steps are described in detail in the sections about the different quantitation techniques.

Step

Action

1

Run the different concentration levels of the standard.

2

  • Integrate the curves to produce peak tables.

  • Check the integration.

3

Identify the components for which calibration curves will be produced.

4

Enter the known concentrations for the different standards to produce a calibration curve for each selected component.

5

Run the sample and integrate the curve.

6

Let the program calculate the concentration and amount of the components of interest in the sample.

Note: The steps above do not apply to Standard addition. See "Standard addition quantitation" below.


Illustration of the work flow

The quantitation work flow is illustrated below.


The four quantitation techniques

The Analysis module provides four different quantitation techniques:

  • External standard quantitation

  • Internal standard quantitation

  • Standard addition quantitation

  • Recovery calculation

Each technique is described below.


External standard quantitation

One or several component(s) of interest are run to produce a calibration curve. The amount and concentration of the component in the sample is then determined from the calibration curve. This technique is fairly simple and usually produces accurate results.


Internal standard quantitation

Peak areas of the components of interest are related to the peak area of an internal standard added in a fixed amount to each concentration level of the standard and to the sample. This technique reduces errors that are caused by changes occurring between the separation runs and is therefore the technique that can produce the highest precision if a suitable internal standard can be selected.


Standard addition quantitation

The sample is spiked with a known amount of the component of interest. The areas of the spiked and unspiked sample are then compared and the amount in the unspiked sample is determined. No calibration curves from standards are used. Only one component can be quantitated. Compared to other techniques, results can be obtained more quickly when you are performing a small number of sample runs with standard addition. However, the precision is limited.


Recovery calculation

Recovery is used to determine the losses that can occur during the sample preparation process. The sample is spiked with a known amount of the component of interest. The amount in the spiked sample is then determined from a calibration curve and is compared with the amount in an unspiked sample. The recovery can only be determined for one component each time.


Analysis procedure instructions

The table below describes the new procedure instructions for quantitation that become available when the Analysis module is installed.

Instruction

Description

QUANTITATE

The instruction calculates the concentration and amounts in the sample from a quantitation table.

Amount and concentration columns will be added to the peak table.

UPDATE

The instruction updates a quantitation table with new data from one standard concentration level.

The default Limit (+/-) value of 12.5% will be used. The quantitation table will not be updated if the peak area or peak height of the new and the previous results differ more than the Limit value.

Note: Either peak area or height is selected for the Limit value.

Default values

The DEFAULT value for the injection value will be taken from the injection volume reported by the Autosampler A-900 from the method. DEFAULT can only be used when the injection is performed by the autosampler.

The DEFAULT value for the concentration level for the standard will be taken from the level entered in the QuantitationData instruction in the method.


2005-06-15