

|
|
|
|
|
How to create and print a customized report
|

|
|
Introduction

|
You can choose from a variety of objects to include in a report,
including chromatograms, methods, documentation, free text and more
in the customized report interface. You can also place, align and
size the objects as you please. This section describes how to create
a customized report format.
Should you need to store store your reports in an electronic
format you can save them as PDF files. This section also describes
how to do this..
|
|
|
|
|
How to open the Report Editor in edit mode
|
The
table below describes how to open the Report
Editor in Edit mode to create
a customized report format.
|
Step
|
Action
|
|
1
|
Open a result file in the Evaluation module.
|
|
2
|
or

Result: The Generate Report dialog box opens.
|
|
3
|
Result: The Create New Report Format dialog
box opens.
|
|
4
|
Result: The Report Editor opens in Edit mode.
|
|
|
|
|
|
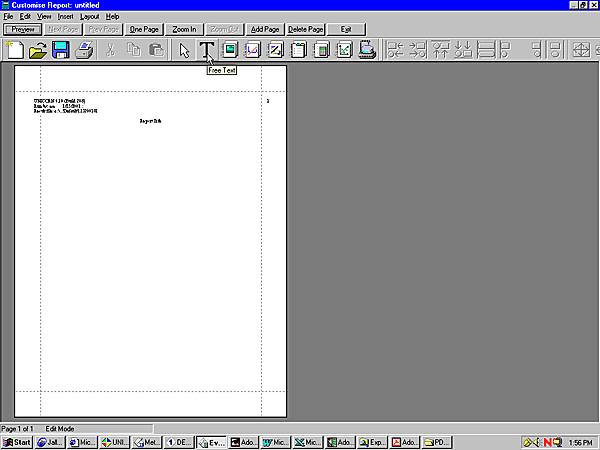
The Edit mode window
|
The illustration below shows the Report
Editor window in Edit mode with
a blank report open:
|
|
|
|
|
Toolbar button functions in the Report Editor
|
The
table below describes the different functions of the Edit mode toolbar buttons
in the Report Editor:
|
Toolbar button
|
Function
|
|
Preview/Edit
|
This button toggles between a print preview of the report
and the Edit mode.
|
|
Next Page
|
This button displays the next page or pair of pages (where
there are more than one page).
|
|
Prev Page
|
This button displays the previous page or pair of pages
(where there are more than one page).
|
|
One Page/Two Pages
|
This button toggles between single page view and pairs
of pages view, when there is more than one page.
|
|
Zoom In
|
This button increases the magnification of the view.
|
|
Zoom Out
|
This button decreases the magnification of the view.
|
|
Add Page
|
This button adds a blank page to the report.
|
|
Delete Page
|
This button deletes the current page from the report.
|
|
Exit
|
This button closes the Customize
Report window.
|
|
|
|
|
|
How to add and delete report pages
|
The
table below describes how to add or delete report pages in the Report Editor:
|
If you want...
|
then...
|
|
to add new pages,
|
Result: A new page
is added after the last page.
|
|
to delete a page while in One
Page mode,
|
-
select the
page with Next Page or Prev Page,
-
click the Delete Page toolbar
button and confirm the deletion.
|
|
to delete a page in Two
Page mode,
|
-
select the
page with Next Page or Prev Page,
-
click an object on the page,
-
click the Delete Page toolbar
button and confirm the deletion.
|
|
|
|
|
|
How to change the page layout
|
The
page layout is changed in the Page
Setup dialog box. The table below describes how to set
up the page layout:
|
Step
|
Action
|
|
1
|
Double-click anywhere on the report page in the Report Editor (not on an object).
Result: The Page Setup dialog box opens.
|
|
2
|
Note: An extra Header tab will appear if you
de-select the option to have the same header on all pages. The First Header tab is used for the
first page header only, and the Header tab
is used for all subsequent pages.
|
|
3
|
|
|
4
|
-
Type header
text in the Free text box
and click the Font button to
alter the default font if necessary.
-
Type the report title in the Report title box and click the Font button to alter the default
font if necessary.
|
|
5
|
-
Select the Logo check box and click the Browse button if you want to locate
and select a logo image file.
-
Select the Alignment for
the logo, if necessary.
Note: The logo file
must be in bitmap format (.bmp)
and smaller than 64 kB. Larger logo files or files in other formats
must be inserted as Picture objects.
|
|
6
|
If you want to have a line under or over the header,
select the appropriate option in the Layout field.
|
|
7
|
Note: All Header and Footer tabs contain the same options.
You can have all information in either the header or footer or split
information between the header and footer as required.
|
|
|
|
|
|
How to add objects to the report
|
The table
below describes how to add objects to the report. The various objects are
described below this table.
|
Step
|
Action
|
|
1
|
or
|
|
2
|
Note: The mouse
pointer shows a symbol for the type of item you have selected.
Result: A Setup dialog box opens. The dialog
is specific to the type of item that you want to insert.
|
|
3
|
Result: The object
is inserted onto the page.
|
Note: If you want
to edit an object later, double-click the object box.
|
|
|
|
|
How to add free text
|
The
table below describes how to add free text to the report:
|
Step
|
Action
|
|
1
|

Result: The Setup Free Text dialog box opens.
|
|
2
|
-
Type text
in the edit field.
-
Select if the text is to start on a new page.
-
Select if the text box should be automatically sized.
-
Select if the text should appear in the same position
on all pages, for example as header and footer text.
|
|
3
|
Result: The Font dialog box opens.
Result: The text
object is inserted onto the page.
|
|
|
|
|
|
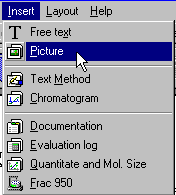
How to add a picture
|
The Picture dialog box is useful to
insert logos, pictures or other figures in the report. The table
below describes how to add a picture object to the report:
|
Step
|
Action
|
|
1
|

Result: The Picture dialog box opens.
|
|
2
|
Note: The file formats .bmp, .emf, .jpg and .tif can
be used.
Result: A preview
of the selected picture is displayed.
|
|
3
|
Result: The picture
is inserted onto the page.
|
|
|
|
|
|
How to add a chromatogram or peak table
|
The
table below describes how to add a chromatogram to the report. The
layout can also be defined to include a peak or pool table
if desired.
|
Step
|
Action
|
|
1
|

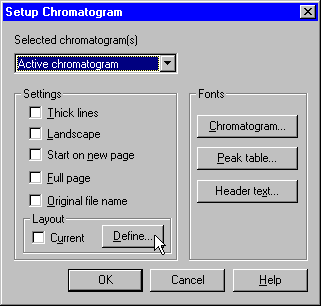
Result: The Setup Chromatogram dialog box
opens.
|
|
2
|
Select which chromatogram(s) to insert from the Selected chromatogram(s) droplist.
-
Active chromatogram inserts the
chromatogram that currently is active in the Evaluation module.
-
All chromatograms inserts
all chromatograms that are open in the Evaluation module.
-
1, 2...etc. inserts
the corresponding chromatogram.
|
|
3
|
Note: Separate fonts
can be selected for the Chromatogram,
the Peak table and the Header text.
|
|
4
|
Result: The Report Chromatogram Layout dialog
box opens.
Note: The changes
that you make will only affect the report and not the view of the
chromatograms in the Evaluation module.
|
|
5
|
Click OK.
Result: The chromatogram
is inserted onto the page.
|
Note: All curves
can be de-selected in the Report Chromatogram
Layout dialog box leaving only the selected peak table(s)
in the report.
|
|
|
|
|
How to include a method
|
The table
below describes how to include a method in the report:
|
Step
|
Action
|
|
1
|

Result: The Setup Method dialog box opens.
|
|
2
|
Select the items to be included in the report:
|
|
3
|
Note: Expand main displays the expanded
method view.
Result: The method
object is inserted onto the page.
|
|
|
|
|
|
How to add documentation
|
The
table below describes how to add documentation to the report:
|
Step
|
Action
|
|
1
|

Result: The Setup Documentation dialog box
opens.
|
|
2
|
Select the items to be included in the report:
|
|
3
|
-
If desired,
change the Fonts.
-
Select if the documentation should start on a new
page.
-
If Select All, Logbook or Run summarySelect All or Logbook was selected,
make the necessary changes to the Base and Logbook filter settings.
-
Click OK.
Result: The selected
documentation items are inserted into the report.
|
|
|
|
|
|
How to add the Evaluation Log
|
The table
below describes how to add the Evaluation
Log to the report:
|
Step
|
Action
|
|
1
|

Result: The Setup Evaluation Log dialog box
opens.
|
|
2
|
Result: The Evaluation Log is inserted into
the report.
|
|
|
|
|
|
How to include Quantitate and Molecular Size data
|
The
table below describes how to include Quantitate and Molecular Size data in the report.
Note: This option
is only available if the Analysis module
has been installed.
|
Step
|
Action
|
|
1
|

Result: The Setup Quantitate dialog box opens.
|
|
2
|
-
If desired,
change the Fonts.
-
The default option is that the Quantitate and Molecular Size data
will start on a new page.
-
Click OK.
Result: The Quantitate and Molecular Size data
is inserted into the report.
|
|
|
|
|
|
How to include Frac-950 data
|
The
table below describes how to include Frac-950 data
in the report.
Note: This option
is available only if a Frac-950 has
been installed and if the result file contains data from the Frac-950.
|
Step
|
Action
|
|
1
|

Result: The Setup Frac-950 dialog box opens.
|
|
2
|
-
If desired,
change the Fonts.
-
Select if the Frac-950 data
should start on a new page.
-
The Include rack layout option
is selected by default. This will display the rack layout that was
used in the run.
-
Click OK.
Result: The Frac-950 data is inserted into
the report.
|
|
|
|
|
|
How to move and resize objects freely
|
The table below describes how to select, move and resize objects
freely:
|
If you want...
|
then...
|
|
to select a single object,
|

|
|
to select several objects,
|
|
|
to move the selected object(s),
|
click on the objects, hold down the left mouse button
and drag the object(s) to the new position.
|
|
to resize the selected object(s),
|
click one of the object border anchors, either in the corners
or in the middle of a border, and drag the box to the new size.
Note: Some Text objects cannot be resized.
|
|
|
|
|
|
Alignment toolbar icon functions
|
Objects
can be placed in exact positions and sized in relation to other
objects. The table below describes the function of the Alignment toolbar icons in the Report Editor:
|
Toolbar icon
|
Function
|
|

|
Align left
Matches the left alignment of all selected objects to that
of the highlighted object.
|
|

|
Align right
Matches the right alignment of all selected objects to that
of the highlighted object.
|
|

|
Align top
Matches the top alignment of all selected objects to that
of the highlighted object.
|
|

|
Align bottom
Matches the bottom alignment of all selected objects to that
of the highlighted object.
|
|

|
Adjust to margins
Stretches the selected object(s) to the left and right margins.
|
|

|
Adjust to left margin
Adjusts the selected object(s) to the left margin.
|
|

|
Adjust to right margin
Adjusts the selected object(s) to the right margin.
|
|

|
Adjust to centre
Adjusts the selected object(s) to the center of the page.
|
|

|
Make same size
Adjusts the selected objects to the same size as the highlighted
reference object.
|
|

|
Make same width
Adjusts the selected objects to the same width as the highlighted reference
object.
|
|

|
Make same height
Adjusts the selected objects to the same height as the highlighted reference
object.
|
Note: The Make same size and Make same width functions can
only be used to resize the width of chromatograms, free text and
picture objects.
|
|
|
|
|
How to print the report
|
The
table below describes how to print the report:
|
Step
|
Action
|
|
1
|
or

Result: The Print dialog box opens.
Note: Printers are set up in
the File menu of the UNICORN Manager.
|
|
2
|
|
Note: You can also
print the report from the Generate
Report dialog box.
|
|
|
|
|
How to save the report in PDF format
|
The
table below describes how to save the finished report as a PDF file:
|
Step
|
Action
|
|
1
|
Result: The UNICORN Manager opens.
Result: The Print Setup dialog box opens.
|
|
2
|
-
Select an
Adobe Acrobat printer from the Printer
Name list (e.g. Acrobat Distiller).
-
Click the Properties button
and edit the document properties if needed.
-
Select the appropriate paper size and orientation.
|
|
3
|
Result: The Evaluation module opens
|
|
4
|
Result: The report
is created as a PDF file and saved in the location specified in
your Acrobat settings.
|
Note: You must have
a full installation of Adobe Acrobat or a suitable printer driver
to be able to do this.
|
|
|
|
|
How to save the report format
|
The table
below describes how to save the finished report format:
|
Step
|
Action
|
|
1
|
or

Result: The Save Report Format dialog box
opens.
|
|
2
|
-
Type a name
for the format.
-
Select
if you want to save the format for global use.
-
Select
if you want to save the format as default.
Note: The name for
the default format will automatically be changed to DEFAULT.
|
|
|
|
|
2005-06-15
|
|
|