|
1
|
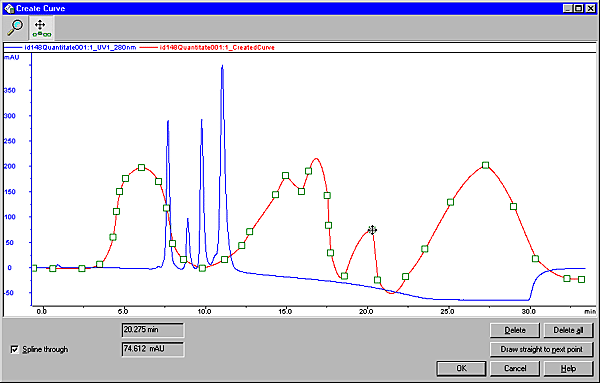
Click the Set Curve Points icon.

|
|
2
|
Result: A green
square marks the new curve point. The curve is drawn from the previous
point. Hold the cursor over the inserted point to see the coordinates
displayed.
Curve mode
|
|
3
|
Move a point
Result: The curve
is redrawn.
|
|
4
|
Delete a curve point
or
or
|
|
5
|
Note: Right-click
and select Reset zoom to
return to the full view.
Result: The coordinates
are displayed in the Marker text
box in the top left corner of the chromatogram.
Note: Click the Marker text box to display the
coordinates for the created curve. Click again to return to the
help curve coordinates.
|
|
6
|
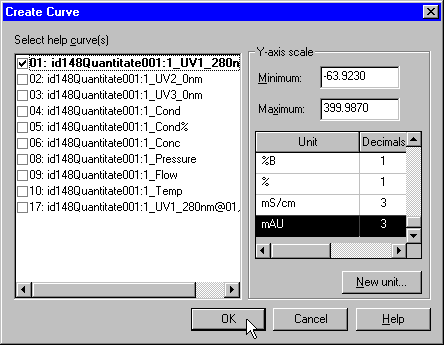
Click OK.
Result: The Save Curve dialog box opens.
|
|
7
|
Type a new name if desired and click OK.
|