|
1
|
Open a result file and select Mol.
Size:Edit Mol. Size Table:New.
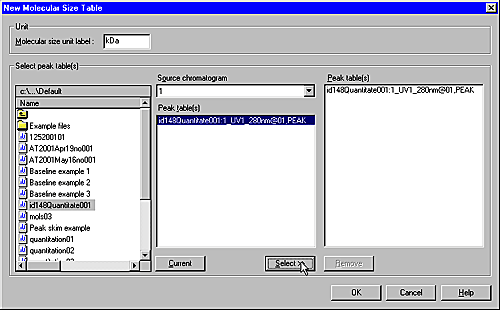
Result: The New Molecular Size Table dialog
box opens.
|
|
2
|
|
|
3
|
Highlight a peak table that was prepared from the standard
in the source Peak table(s) list
and click the Select button.
|
|
4
|
Repeat step 3 to select more peak tables.
Note: The runs must
all have been made under the same conditions.
|
|
5
|
To deselect a table, highlight the table in the Peak table(s) list to the right
and click the Remove button.
|
|
6
|
Repeat steps 2 to 4 to select peak tables from other
result files.
|
|
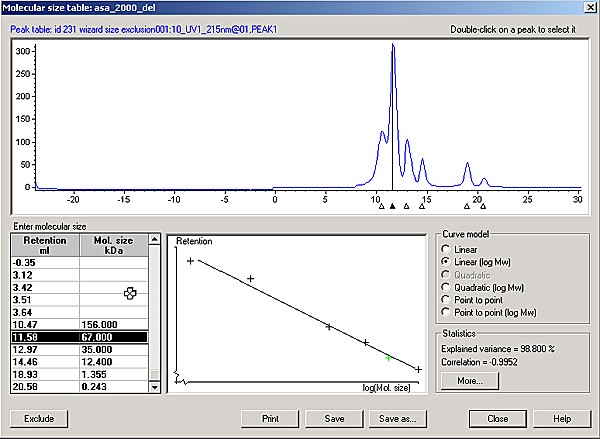
7
|
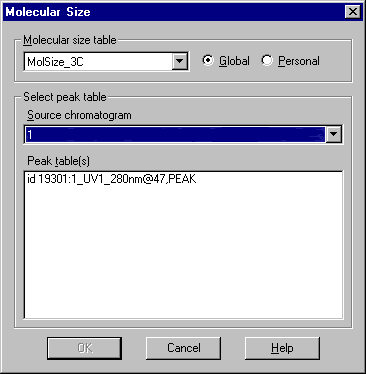
Result: The Molecular size table dialog box
opens.
|
|
8
|
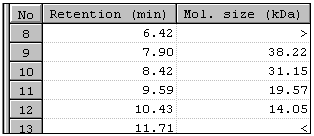
Use one of the following ways to select a peak:
|
|
9
|
Double-click in the Mol.
size column cell and type the known molecular size from
the standard.
|
|
10
|
Repeat step 8 and 9 for all components of known molecular
size.
|
|
11
|
To remove unwanted entries, click the peak entry in
the table and click the Exclude button.
|
|
12
|
Select the appropriate curve model in the Curve model field (see "The molecular
size curve" below).
|
|
13
|
Click the Save as button.
Result: The Save molecular size table dialog
box opens.
|
|
14
|
|