|
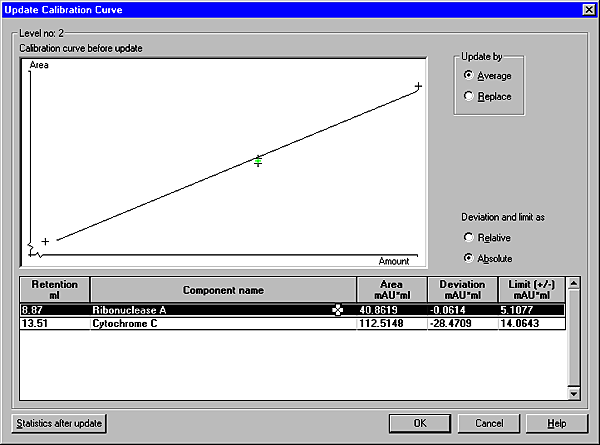
The Update Calibration Curve dialog box

|
Data on the selected components for the curve to be updated
are shown in the Component name table.
When a component is highlighted, its calibration curve is displayed
above in the Calibration curve before
update field.
The calibration curve to be updated is shown without taking
the new point into consideration. A new point is shown either in
green or red. If it is green, the area falls within the set Limit (+/-) value and this point
will be used for calculation of the new calibration curve, instead
of the old point. If it is red, it falls outside this range.
|