|
1
|
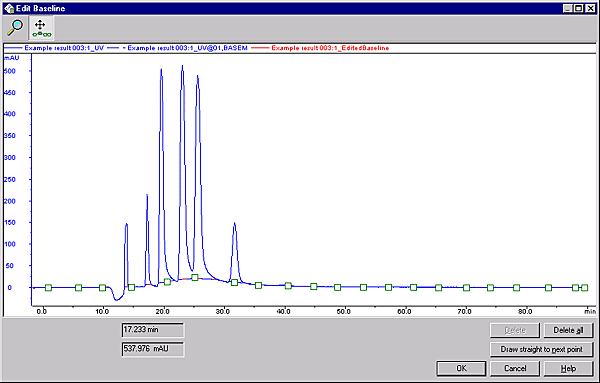
Select Integrate:Edit
Baseline.
Result: If there
are more than one baseline available, the Select Baseline
to Edit dialog box opens. If not, proceed to step 2.
Result: The Edit Baseline dialog box opens
|
|
2
|

Result: The cursor
is changed into a cross.
|
|
3
|
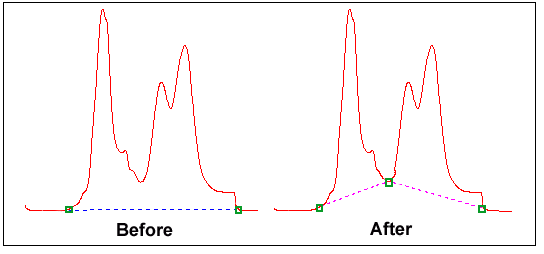
Add a data point
Result: A new point
is created, marked by a green square. The baseline curve is redrawn
as a spline function based on the old and the new points. The baseline
is guided by the points, but does not necessarily pass through them.
|
|
4
|
Delete a data point
or
or
Result: The data
point is deleted and the curve is redrawn.
|
|
5
|
Move a data point
Result: The baseline
curve is redrawn.
|
|
6
|
Click OK.
Result: The Save Edited Baseline dialog box
opens.
|
|
7
|
Result: The new
baseline is saved.
|