How to integrate part of a curve and how to exclude or skim peaks


Introduction

There are several possibilities to improve the results if the peak integration is unsatisfactory. This section describes:

  • How to select only part of a curve for integration.

  • How to exclude peaks.

  • How to skim peaks.

These operations can be performed both in the Integrate dialog box in preparation for the peak integration, or in the Edit Peak Table dialog box to adjust an unsatisfactory peak integration. This section describes both alternatives.


How to select part of a curve

The table below describes how to select only a part of a curve for peak integration in the Integrate dialog box:

Step

Action

1

  • Choose Integrate:Peak Integrate.

Result: The Integrate dialog box opens.

  • Click the Peak Window button.

Result: The Peak window dialog box opens.

2

  • Type new X-axis values for the Left limit and the Right limit.

or

  • Drag the vertical cursor lines to define the limits.

3

Click OK.

Result: The baseline will be calculated from the whole curve, but the calculation of the peak areas is only performed on the selected section.


How to exclude peaks

You can define criteria to exclude peaks from integration. The table below describes how to define peaks to be excluded in the Integrate dialog box.

Step

Action

1

Click the Reject peaks button.

Result: The Reject Peaks dialog box opens.

2

  • Select the appropriate checkboxes and type values for height, width and area.

  • Define how many of the largest peaks you want to include.

  • Click OK.


How to include negative peaks

Select the Accept negative peaks checkbox of the Integrate dialog box to include negative peaks in the integration.

Result: The negative peaks will be reported as negative areas in the peak table. By default, negative peaks are not included in the integration.


Peak skimming vs. drop-lines

The area under a peak can be calculated either using separating drop-lines or peak skimming:

  • Drop-lines are vertical marks that split two peaks at the valley. Drop-lines are used mostly for peaks of relatively similar size. When a peak has a shoulder, splitting with drop-lines will cause the first peak to lose too much of its area to the peak that forms its shoulder.

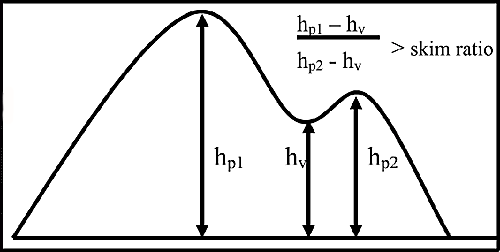
  • The Peak skim option can be used to skim off the smaller peak with a straight line that starts in the valley between the peaks and ends at the other side of the smaller peak, at the point where the skim line and the curve slope are equal.

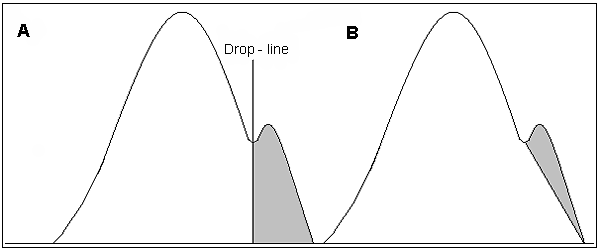
The illustration below is an example of how a drop-line (A) and a skimmed peak (B) affects the area under the main peak and the peak shoulder. The peak shoulder area is marked in gray:


How to skim peaks

The table below describes how to select a ratio to skim peaks in the Integrate dialog box:

Step

Action

1

Select the Peak skim checkbox.

2

Determine the ratio when peak skimming should be applied based on the relationship in the illustration below:

Note: The default ratio value is 10.

3

Type the ratio value in the text box.


How to integrate part of a curve

Part of a curve can be selected in the Edit Peak Table dialog box and integrated with settings that differ from the rest of the curve. The table below describes how to do this.

Step

Action

1

  • Choose Integrate:Edit Peak Table.

Result: The Select Peak Table to Edit dialog box opens.

  • Select the peak table to edit and click OK.

Result: The Edit Peak Table dialog box opens.

2

  • Click the Peak Window icon.

Result: Two vertical cursor lines are displayed.

  • Drag the cursor lines to the beginning and the end of the selected part of the curve.

Note: All operations described below will only affect the selected part of the curve.

3

If desired, change the integration parameters:

Reject peaks

  • Choose Integrate:Settings.

Result: The Reject Peaks dialog box opens.

  • Change the settings as desired and click OK.

Skim peaks

  • Choose Integrate:Peak Skim.

Result: The Peak Skim dialog box opens.

  • Select the Skim Peaks checkbox and type a ratio.

  • Click OK.

4

  • Choose Integrate:Peak Integrate.

Result: The selected part of the curve is peak integrated based on the changed parameters.


2005-06-15