How to match protein activity to a curve


Introduction

You can compare data from the results of protein activity assays, such as ELISA, with the data contained in the UV curve. The activity curve and the UV curve can be compared in a combined presentation.


The Activity Histogram dialog box

The illustration below shows the Activity Histogram dialog box:


How to enter protein activity values for comparison

The table below describes how to enter the values from a protein activity assay in a comparison histogram:

Step

Action

1

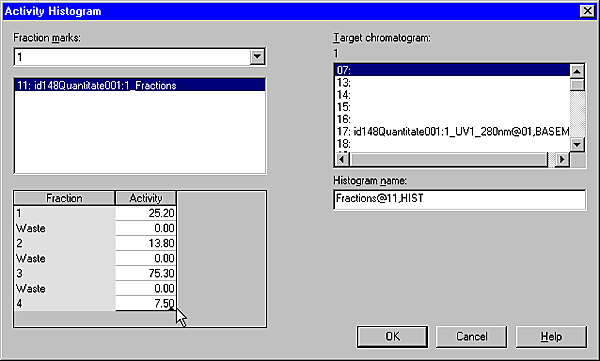
Choose Operations:Activity Histogram.

Result: The Activity Histogram dialog box opens.

2

By default, the fraction curve for the specific chromatogram is selected.

  • If necessary, change the source and target chromatograms.

All the component fractions of the fraction curve are listed in the Fraction/Activity field.

  • Type an activity value for each fraction in the Activity column.

  • Click OK.


2005-06-15