|
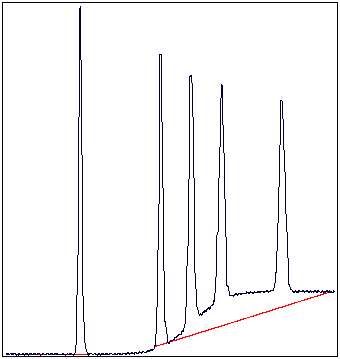
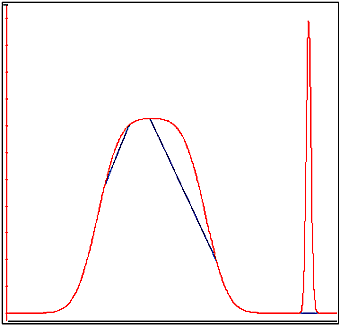
A too high Slope limit value
can cause peak limits too high up on the peaks. This can be the
case when the chromatogram includes a very large flow-through or solvent
peak. The large peak affects the calculation of the default parameters
and leads to too high values for the Slope
limit.
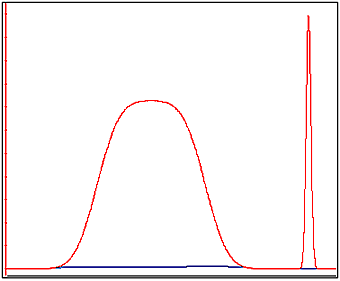
Note: A too high
value for the Noise window can
have the same effect and be caused by the same situation, often
also in combination with a high Slope
limit.
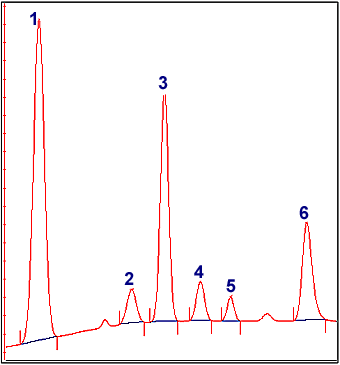
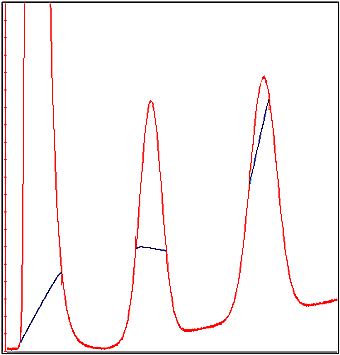
Peak limits are defined on peaks in the example below due
to the high Slope limit:
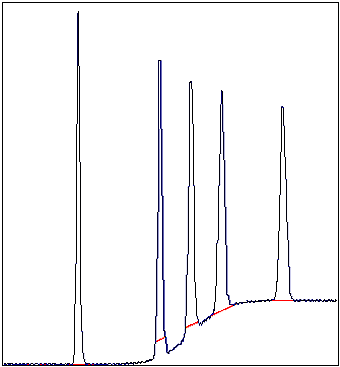
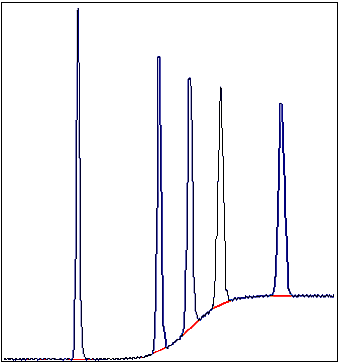
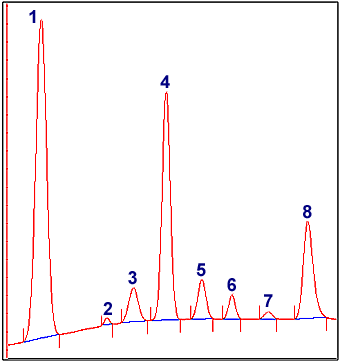
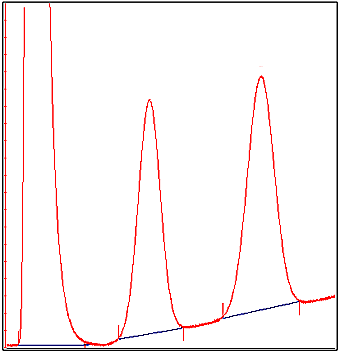
The example below has a much lower Slope
limit, and a lower Noise
window:
|