How to subtract a blank run curve


Introduction

Subtracting a blank run curve is a frequently used function in presentations, especially if the curves have a drifting baseline or ghost peaks.


Ghost peaks

If the ghost peaks come from impurities in the eluents, all equilibration of the columns should be the same from method run to method run. If, for example, the equilibration volume with buffer A is larger before a blank run curve than before a separation, your ghost peaks might be higher in the blank run curve.


Example of a UV curve with baseline

The illustration below shows the UV curve with baseline prior to subtraction of the baseline:


Example of a UV curve after subtraction of the baseline

The illustration below shows the UV curve after subtraction of the baseline:


How to import a blank run curve
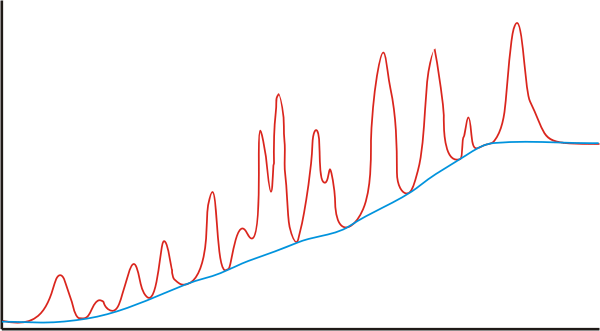
If a blank run curve was made, this might have been stored in another result file. If there is no blank run curve, you can create one with Integrate:Calculate baseline. The table below describes how to import the blank run curve:

Step

Action

1

Ensure that the destination chromatogram has been opened and is the active window on the screen.

2

Choose File:Open:Curves.

Result: The Open Curves dialog box is displayed.

3

Double-click the result file that contains the blank run curve.

Result: The curves in the first chromatogram are displayed.

4

  • Select the appropriate chromatogram in the Chromatogram list.

Result: The curves for that chromatogram are displayed on the Available list.

  • Select the curves that correspond to the blank run curve and click the Select button.

Result: The selected curve is displayed on the Selected curves list.

5

  • If you want to remove a curve from the list, select it and click the Remove button.

  • Click OK to import the curve.

Note: For more detailed information on how to import curves, chromatograms and other results see How to import and compare different runs.


How to subtract a blank run curve

You can subtract the blank run curve or the baseline from the sample curve. The table below describes how to do this:

Step

Action

1

Select Operations:Subtract.

Result: The Subtract dialog box is displayed.

2

Select the sample chromatogram and curve in the left field and the baseline or blank run curve to be subtracted in the middle field.

Click OK.

Note: All resulting curves from the subtract operation receive the SUB suffix by default. The default curve name can be changed as needed.


2005-06-15