Measurements


Introduction

It is possible to determine the coordinates of any point on a curve and to obtain values for retention and peak height. This is a useful tool for many other functions, such as for measuring the parameters used in baseline calculations.


Measurement options

Coordinates can be obtained in two ways:

  • Through direct measurement.

  • From peak table data.


How to make direct measurements

The table below describes how to make direct measurements in a chromatogram:

Step

Action

1

Right-click in the chromatogram and select Marker.

Result: A vertical line is set in the chromatogram. A text box in the top left corner of the chromatogram displays the X-axis and Y-axis values of the curve at the point where the vertical Marker line crosses the curve. See the illustration below:

Note: The color of the Marker is the same as the selected curve.

2

Move the Marker with your mouse to display the peak data.

3

Click the curve name legend above the chromatogram to change to another curve.

Result: The Y-axis is changed to the one corresponding to the new curve.

4

Right-click and select Marker again to de-select the function.


How to set a reference point

The table describes how to set a reference point:

Step

Action

1

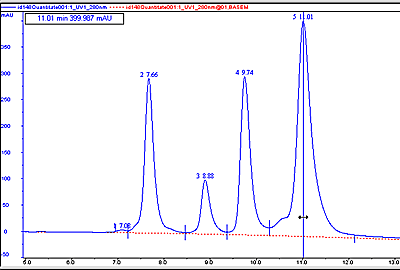
Right-click in the chromatogram and select Set Marker Ref. Point to define a reference point for the marker position.

2

When the marker is moved from the reference point, the X-axis and Y-axis values for the new position are displayed together with:

  • the new position in relation to the position of the reference point,

  • the minimum, maximum and average values for the curve interval between the reference point and the new position.


How to record a Snapshot

The table below describes how to record a Snapshot of the current curve values:

Step

Action

1

  • Right-click in the chromatogram and select Snapshot from the shortcut menu.

Result: The Snapshot dialog box opens.

2

The dialog box displays all the curve data that was current at the moment the snapshot was taken.

  • Click the Save to file button to save the snapshot as an Excel file.

  • Click the Print button to print the snapshot.


How to select peak table data

The retention time and amplitude of any peak can be viewed directly in a peak table after an integration. This data and more is selected in the Chromatogram Layout dialog box. The table below describes how to select peak table data.

Step

Action

1

Click the Chromatogram Layout icon.

Result: The Chromatogram Layout dialog box opens.

2

Click the Peak Table tab.

3

  • Select the checkboxes on the Select peak table columns list for all items that you want to display in the table.

  • Click OK.


2005-06-15