|
The
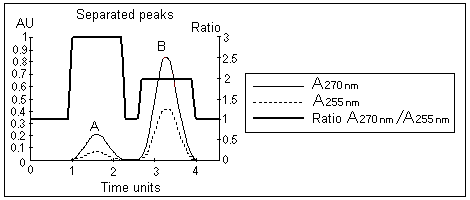
absorbance ratio can be used to check peak purity. If the peak is
pure, the absorbance spectra are the same over the whole peak and
the ratios should therefore remain constant. The peak is probably
not pure if the absorbance ratio is not the same over the whole
peak.
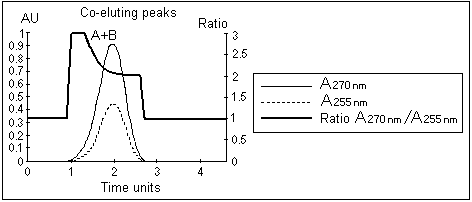
The illustration below shows a simulated chromatogram of two
co-eluting components with differing absorbance spectra and a small
difference in retention time:
|