|
Amount
|
Values calculated by the Analysis module.
(Only available if the Quantitation module
is installed.)
|
|
Area
|
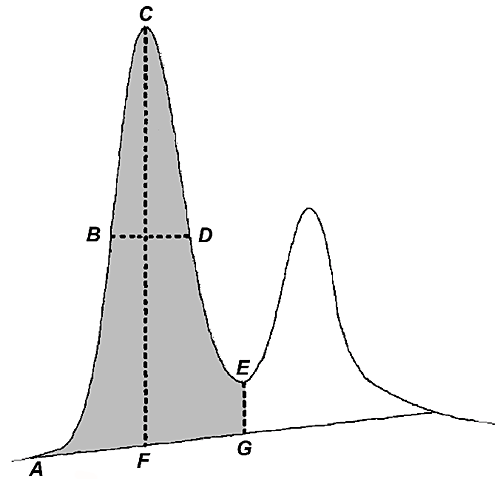
Calculated as the area between the curve and baseline,
between the peak start and peak end, time or volume base. (Gray
area in the diagram above.)
|
|
Asymmetry
|
Peak asymmetry (indicator of column packing). See definition
below this table.
|
|
Baseline height
|
Baseline amplitude at peak start, peak maximum and
peak end. (A, F and G in the diagram above.)
|
|
Capacity factor
|
The capacity factor will only be calculated when the
chromatogram is in volume base. The total liquid volume, Vt, must
be entered in the Integrate dialog
box for this parameter to be calculated. See definition below this
table.
|
|
Concentration
|
Values calculated by the Analysis module.
(Only available if the Quantitation module
is installed.)
|
|
Fraction tube id
|
Fraction number at peak start, peak maximum and peak
end.
|
|
Height
|
Maximum amplitude above the baseline. (C-F in the diagram
above)
|
|
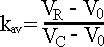
Kav
|
Gel phase distribution constant in gel filtration.
Kav will only be calculated when a gel filtration column was used and
when the chromatogram is in volume base. The void volume, V0, must be
entered in the Integrate dialog
box for this parameter to be calculated. See definition below this
table.
|
|
Molecular size
|
Values calculated by the Analysis module.
(Only available if the Quantitation module
is installed.)
|
|
Plate height (HETP)
|
Height equivalent to theoretical plate and plates/meter.
The column height must be entered in the Integrate dialog
box for this parameter to be calculated. See definition below this
table.
|
|
Peak endpoint heights
|
Amplitude above the baseline at left (A in the diagram
above) and right peak limits (E-G in the diagram above).
|
|
Peak endpoint retention
|
Retention value at peak start and peak end, time or
volume base. (A and G in the diagram above.)
|
|
Peak name
|
Name of the peak.
|
|
Percent of total area
|
Peak area as a percent of the total area under the
curve above the baseline. Time or volume base.
Note: This value
can differ in time and volume base if the flow rate is not constant
throughout the method.
|
|
Percent of total peak area
|
Peak area as a percent of the sum of all integrated
peaks.
Note: This value
can differ in time and volume base if the flow rate is not constant
throughout the method.
|
|
Resolution
|
Peak resolution. See definition below this table.
|
|
Retention
|
Retention at the peak maximum, time or volume base.
(C in the diagram above.)
|
|
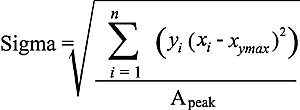
Sigma
|
Standard deviation for a Gaussian-shaped peak. See
definition below this table.
|
|
Type of peak limits
|
Identifies the criteria for peak start and peak end
as either the baseline intersection or dropline to the baseline
or skim line.
|
|
Width
|
Difference in retention between the peak end and peak
start, time or volume base. (G-A in the diagram above.)
|
|
Width at half height
|
Calculated by taking the maximum height of the peak
above the baseline, then determining the peak width at half this
value above the baseline. Time or volume base. (B-D in the diagram above,
where BD bisects CF.)
|