Standard addition quantitation


Stages in standard addition

Standard addition is performed in five stages:

Stage

Description

1

Perform two runs.

2

Copy the curves into one result file.

3

Integrate the curves to produce the peak tables.

4

Select the component to be used.

5

Evaluate the amount of a component in the sample.


How to prepare for the Standard addition quantitation

The table below briefly describes how to prepare for the quantitation.

Step

Action

1

Perform a sample run with the unspiked sample and a run with the spiked sample.

2

Open one of the two result files. Use File:Open:Curves to copy the second curve to the opened result file.

3

Peak integrate the sample curves to produce the peak tables for the unspiked and the spiked samples.

Note: The sample curves must use the same X-axis base unit. Time is the recommended unit for highest reliability.

4

  • Check that the integrations are correct.

  • Optimize the peak integration if necessary.

5

Select File:Save to save the peak table.


How to select the component and identify the sample peaks

The table below describes how to select the component to be used for the standard addition and how to identify the sample peaks.

Step

Action

1

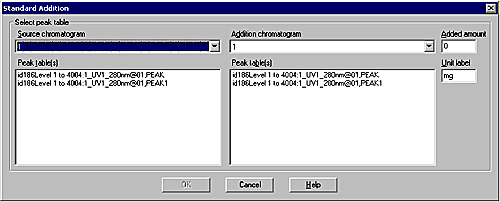
Select Quantitate:Standard addition

Result: The Standard Addition dialog box opens.

2

  • Select the chromatogram that contains the peak table for the unspiked sample in the Source chromatogram droplist.

  • Select the unspiked sample peak table from the Peak table(s) list to the left.

3

Repeat step 2 in the Addition chromatogram section to the right to select the addition peak table for the spiked sample.
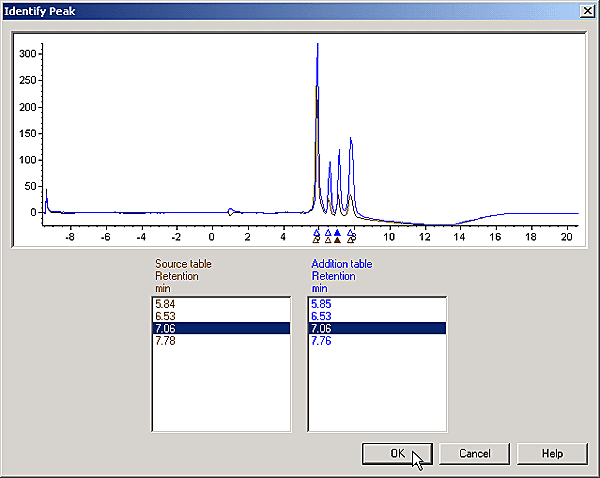
4

  • Edit the default unit mg in the Unit label field if necessary.

  • Type the amount of the component that was added as the spike in the Added amount field.

  • Click OK.

Result: The Identify Peak dialog box opens.

5

To locate and select the peak of the unspiked sample, do the following:

  • Click its triangle marker (black) or select its reference in the Source table.

6

  • Repeat step 5 to select the spiked sample. The triangle color is blue. Use the Addition table.

  • Click the OK button.


The Identify Peak dialog box

The illustration shows the Identify Peak dialog box, described in the table above.


How to view the quantitation results

The amount of the component of interest is displayed in the peak table Amount columns of the Evaluation module.


2005-06-15