

|
|
Statistics
|

|
|
Introduction

|
This section explains the correlation and explained variance
calculations that are used by the Analysis module.
|
|
|
|
|
Correlation
|
The Analysis module calculates the
correlation coefficient for linear models. This shows how well the
data are linearly related. The correlation is displayed in the Statistics table.
If you are producing a calibration curve that relates peak
area or height to amount or concentration, you aim to achieve a
high positive correlation coefficient. A value of +1 indicates a
perfect fit of all the data to the straight line. A molecular size
curve has a negative slope, so the aim is towards a correlation
coefficient of -1.
|
|
|
|
|
Too few data points
|
If you only have two data points for a Linear model, or only one point
for a Linear through origin model,
the fitted straight line will inevitably pass exactly through the
points. By definition, this leads to a correlation of exactly +1,
but this does not indicate a good fit, but instead indicates too
few data points. In these cases the Statistics table
will display a “---” symbol
instead of the correlation value.
|
|
|
|
|
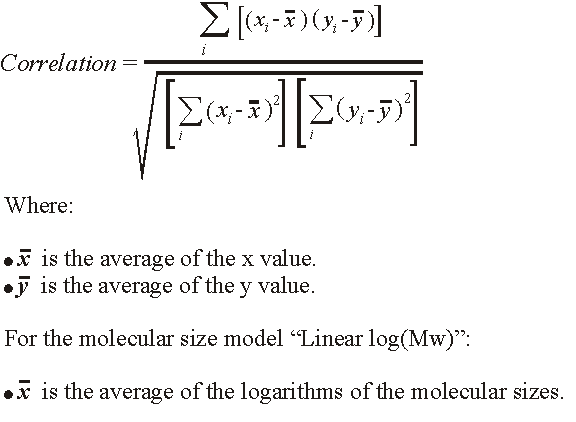
Correlation calculation
|
The correlation is derived as follows:
|
|
|
|
|
Explained variance
|
Explained
variance provides a measurement of how much of the variation in
the data points (xy pairs) is due to the model. The remaining variation
can be attributed to noise, i.e. random errors, or to the fact that
an inappropriate model has been selected. This makes it possible
to use the explained variance value for model selection, e.g. to
decide if a quadratic model fits the data better than a linear model.
This would be confirmed by a higher explained variance value.
Note: The explained
variance is not calculated for curve models drawn through the origin.
|
|
|
|
|
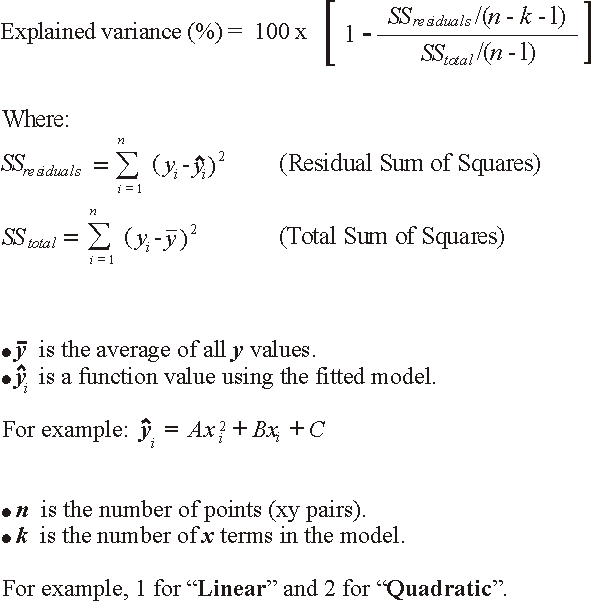
Explained variance calculation
|
The explained variance is equal to R2 adjusted
for degrees of freedom. The illustration below shows the mathematical
model:
|
|
|
|
|
Undefined value for explained variance
|
You can only obtain a value for explained variance if you
have sufficient data points on the curve. For instance, if you only
have two points for a Linear model,
or only three points for a Quadratic model,
the fitted curve will pass exactly through the points. By definition,
this leads to an undefined value for explained variance. In these
cases the Statistics table
will show a “---” symbol
instead of an explained variance value.
|
|
|
|
2005-06-15
|
|
|