

|
|
|
|
|
The Curves pane
|

|
|
Introduction

|
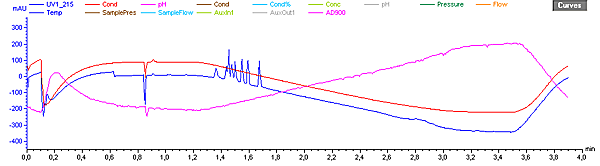
The Curves pane of the System Control module displays
monitor signal values graphically.
The figure below shows an example of the Curves pane:
|
|
|
|
|
How to select curves to be displayed
|
You
can decide which curves you want to display in the Curves pane. Curves will only
be shown for components present in the chromatography system.
The table describes how to select the curves to be displayed
on the screen.
|
Step
|
Action
|
|
1
|
In System
Control,
select View:Properties.
Result: The Properties dialog box is displayed.
|
|
2
|
Select the Curves tab.
Note: The
curves in the list are those for which Store is
set to On in the system
settings, together with any reference curves defined in the method.
|
|
3
|
In the Display curves list,
select the curves you want to display.
If you want all curves to be displayed, click the Select All button. If you do not
want any curves to be displayed, click the Clear
All button.
Click OK.
|
|
|
|
|
|
How to display a vertical marker line
|
The table
below describes how to display a vertical marker line:
|
Step
|
Action
|
|
1
|
Right-click the Curves pane
and select Marker.
|
|
2
|
Drag the marker line with the mouse.
Result: Where the
line bisects the curve, the X-axis and Y-axis values are displayed
at the top right corner of the pane.
|
Note: Right-click
and select Snapshot to record
the marker position values. See Snapshots
for more information about the Snapshot function.
|
|
|
|
|
How to set a reference point
|
When the
vertical marker is displayed, you can set a reference point to display
curve data. The table describes how to set a reference point:
|
Step
|
Action
|
|
1
|
|
|
2
|
When the marker is moved from the reference point,
the X-axis and Y-axis values for the new position are displayed
together with:
-
the new position
in relation to the position of the reference point,
-
the minimum, maximum and average values for the
curve interval between the reference point and the new position.
|
|
|
|
|
|
How to change the curve colors and styles
|
The Curves pane displays graphs for
the selected curves in different colors, with any reference curves
included with the method as dashed lines.
The table below describes how to change the curve colors and
styles:
|
Step
|
Action
|
|
1
|
Select View:Properties.
Result: The Properties dialog box is displayed.
|
|
2
|
Select the Curve Style
and Color tab.
|
|
3
|
|
|
|
|
|
|
How to change the scale of the Y-axis
|
In most
cases, the Y-axis is automatically scaled for each of the curves.
Values on the Y-axis apply to the curve with the same color as the
axis markings. To get the correct Y-axis, click the legend. The
table below describes how to fix the scale of individual curves.
|
Step
|
Action
|
|
1
|
Result: The Properties dialog box is displayed.
|
|
2
|
|
|
3
|
Repeat step 2 for other curves if needed.
|
|
4
|
Click OK.
|
|
|
|
|
|
How to change the scale of the X-axis
|
The
table below describes how to change the scale of the X-axis:
|
Step
|
Action
|
|
1
|
Result: The Properties dialog box is displayed.
|
|
2
|
Select the appropriate base, Time or Volume.
Note: Curves are
collected in time and recalculated for display in volume. Thus,
the resolution of the two bases may appear slightly different.
|
|
3
|
Select the appropriate Axis
scale:
-
Total will show the curves as
far as they have come in the run.
-
Window allows
you to set the portion of the total pane to be displayed, either
in minutes or ml depending on the selected base.
-
Adjust
retention zero to injection sets the retention value
to zero at the point of the first injection.
|
|
|
|
|
|
How to switch between time and volume units
|
or
to switch the display between time and volume units. The run
is controlled according to the time/volume base defined in the current
block, regardless of the base in the curves display.
|
|
|
|
|
How to zoom in the Curves pane
|
The
table below describes how to zoom in on a selected region of the
curve pane:
|
Step
|
Action
|
|
1
|
Result: The display
is now zoomed in on the selected area.
|
|
2
|
Repeat the process for further magnification of selected
areas.
|
How to zoom out
To
reduce the scale of the zoom, right-click in the Curves pane, and select one of the
following options:
|
|
|
|
|
How to select curve pressure units
|
If
the Pressure curve is displayed
in the Curves pane, you
can set the displayed units. The table below describes how to do
this:
|
Step
|
Action
|
|
1
|
Right-click in the Curves pane,
and select Properties in
the displayed menu.
Result: The Properties dialog box is displayed.
|
|
2
|
Select the Y-Axis tab.
|
|
3
|
Select the Pressure curve
and select the appropriate Pressure
unit button.
Click OK.
|
|
|
|
|
|
How to edit text in the Curves pane
|
You can select
the way that text is aligned for the Logbook and Fraction curves. You
can also select to show only part of the Logbook information.
The table below describes how to do this:
|
Step
|
Action
|
|
1
|
Right-click in the Curves pane,
and select Properties in
the displayed menu.
Result: The Properties dialog box is displayed.
|
|
2
|
Select the Curve Style
and Color tab.
|
|
3
|
Select the following:
-
Logbook
or Fraction curve
in the Curve list as appropriate.
-
Select the appropriate Logbook
text alignment or Fraction text alignment option:
Horizontal
Vertical
Fly over (displays the text if you place the
mouse pointer over the generated mark).
|
|
4
|
To filter the type of Logbook information
overlaid on the Curves pane,
do the following:
-
Click the Filter button.
Result: The Filter Logbook dialog box is displayed.
-
Select the appropriate check boxes and set the maximum
block depth.
-
Click OK to
return to the Curve style and Color tab.
|
|
5
|
Click OK.
|
|
|
|
|
|
How to view the complete logbook information
|
At
some breakpoints there can be more logbook information than what
is possible to conveniently display in the Curves pane.
The additional information that is not displayed is indicated by
an arrow point symbol by the break point.
|
|
|
|
2005-06-15
|
|
|