External and internal standard quantitation


Introduction

This section describes how to perform quantitation in the Evaluation module using either an external standard or an internal standard.

The processes involved in both external standard and internal standard quantitation of a sample are very similar. The procedural differences mainly concern the creation of the quantitation tables. A quantitation table is specific to either external standard or internal standard quantitation.


Method for the sample runs

The method that is used for the sample runs must be the same as for the standard runs. If the method is created from a wizard or a template for ÄKTAdesign systems, select Sample in the variable Quantitation_Type on the Variables tab in the Run Setup.


How to prepare for the quantitation

The table below describes briefly how to prepare for the quantitation.

Step

Action

1

Prepare a quantitation table for the components of interest.

See How to create a quantitation table for further information.

2

Perform a sample run.

Note: If internal standard quantitation is used, the internal standard must have been added to the sample prior to the sample preparation procedure. The injected amount must be the same as on the standard levels.

3

Open the sample result file and peak integrate the sample curve to produce a peak table.

Note: The sample curve must use the same X-axis base unit as the standards during the integration. Time is the recommended unit for highest reliability.

4

Select File:Save to save the peak table.


How to calculate the amount and concentration

The table below describes how to calculate the amount and concentration in the sample.

Step

Action

1

Select Quantitate:Calculate amount and conc.

Result: The Calculate Amount and Concentration dialog box opens.

2

  • Select a quantitation table on the Quantitation table droplist.

  • Select the chromatogram that contains the sample curve on the Source chromatogram droplist.

  • Select the sample peak table from the Peak table(s) list.

  • Check the Injection volume value and type a new value if necessary.

Note: For internal standard quantitation, the injection volume must be the same as used for the standard runs.

  • Click the OK button.

Result: The peak table is updated.


How to view the quantitation results

The 
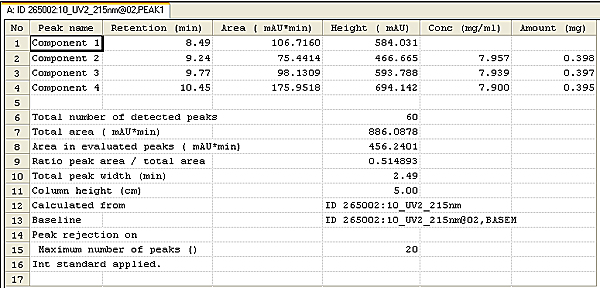
results of the quantitation are shown in the Concentration and Amount peak table columns of the Evaluation module.The Peak Names are shown in the table and the type of quantitation is also listed. See illustration below:

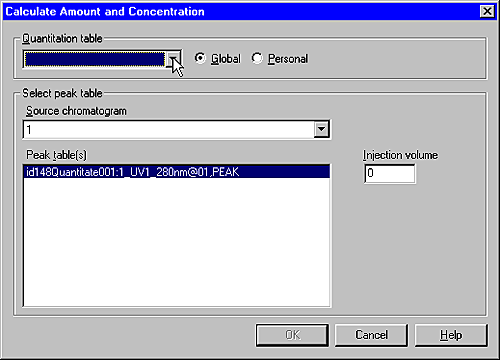
The quantitation table used for the quantitation

When the result file is saved, it includes the quantitation table that was used for the quantitation. You can view the table that was used by selecting Quantitate:Edit Quantitation Table:View Current.


If the amount cannot be calculated

If the amount cannot be calculated, one of the following signs is shown in the peak table Amount column:

Sign

Function

>

This means that the value is higher than the highest value in the calibration curve, i.e. outside the valid range of the calibration curve.

<

This means that the value is lower than the lowest value in the calibration curve, i.e. outside the valid range of the calibration curve.

-

This means that the value cannot be calculated. For example, this sign might indicate that the peak could not be identified.


2005-06-15