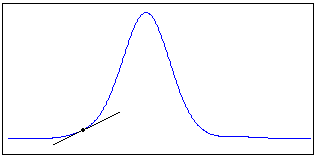
How to find slope values


Introduction

With ÄKTAdesign systems it is possible to only collect peaks during fractionation. The way to find suitable slope values for a particular run is described in this section.


Where to use slope values

The slope values can be used in the Method Editor

  • as StartSlope and EndSlope values in the Peak_FracParameters instruction.

  • as parameters for the Watch instruction.

Using slope values for Watch instructions

Conditional Watch instructions can be set up to let the progress of a run be determined by the events during the run, e.g. start to collect fractions when the first peak emerges.

The slope of the curve can be set as a condition to satisfy a Watch condition in the method during the run. It is important to use accurate slope values for the specific Watch instruction parameter.


A sample run

You must first make a separation run with the sample you intend to purify. The result from this separation run is then used to find the slope values.


Retention scale

Time should be used as the X-axis scale for retention.

Step

Action

1

Click the Chromatogram Layout icon.

2

  • Click the X-axis tab.

  • Select Time.

  • Click OK.


How to differentiate the curve

The slope values are measured on a differentiated curve. The table below describes how to create a differentiated curve.

Step

Action

1

Select Operations:Differentiate.

Result: The Differentiate dialog box opens.

2

  • Select the UV curve you want in the Source chromatogram list.

  • Click the First order radio button.

  • Click OK.

Result: The differentiated curve opens in the chromatogram.


How to measure the slope values

Sometimes the differentiated curve must be filtered to reduce noise and ghost peaks before the measurements. See section Peak purity and peak identification.

The table below describes how to measure the slope values on the differentiated curve.

Step

Action

1

Click the name of the differentiated curve (above the chromatogram window) to select the curve.

2

Use the zoom function to magnify the curve over an appropriate area.

3

Right-click and select Marker from the short-cut menu.

Result: A vertical cursor bar opens in the chromatogram.

4

Place the Marker at the beginning of a peak where you want the Watch conditions to be fulfilled, i.e. where the slope becomes higher.

5

Read the actual slope value in the active Marker text box in the top left corner of the chromatogram window.

Note: The unit for the differentiated curve is mAU/min or AU/min. Any Y-axis value for the differentiated curve is the UV curve slope at the selected retention point.


Peak fractionation for ÄKTAdesign

If your system is an ÄKTA™ design system, measure the slope at the beginning and the end of the smallest, flattest peak of all the peaks of interest, and use these values.


Illustration: Slope value measurement

The illustration below shows a measurement of the slope limit after differentiation:


2005-06-15