

|
|
|
|
|
How to use the Multifile Peak Compare wizard
|

|
|
Introduction

|
This section describes how to use the Multifile
Peak Compare wizard to make comparisons between different
results, for example, by comparing area, retention etc. The difference
can be presented graphically or in a spreadsheet.
|
|
|
|
|
Step 1: How to select the Operation
|
The table
below describes how to select the operation:
|
Step
|
Action
|
|
1
|
In the Evaluation module,
or
Result: The Multifile Peak Compare wizard
entry dialog box is displayed.
|
|
2
|
Click the Next button
to display the Operation dialog
box.
|
|
3
|
Select
If you select Batch quantitate:
If you select Batch Mw determination:
Click the Next button
to proceed to the Data Selection dialog box.
|
|
|
|
|
|
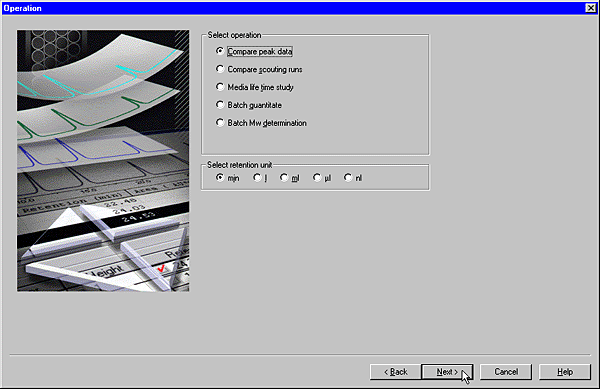
The Operation dialog box
|
The illustration below displays the Operation dialog
box:
|
|
|
|
|
The operation options
|
The table below is a brief description of the operation options:
|
Operation
|
Description
|
|
Compare peak data
|
This option is used to compare different results.
|
|
Compare scouting runs
|
This option is used to compare the results from scouting
runs. The scouting variables can be displayed.
|
|
Media life time study
|
This option features different default values than
the Compare peak data option,
specially selected to measure changes in the column media.
|
|
Batch quantitate
|
This option is used to run several quantitations. This
is an alternative to Quantitate:Calculate
Amount and Conc. which is used to quantitate single results.
A quantitation table must be created before this option can be used.
This option is available only if the Analysis module
has been installed.
|
|
Batch Mw determination
|
This option is used to batch run molecular size calculations.
This is an alternative to Mol. Size:Calculate
Mol.Size, which is used for single calculations. A molecular
size table must be created before this option can be used.
This option is available only if the Analysis module
has been installed.
|
|
|
|
|
|
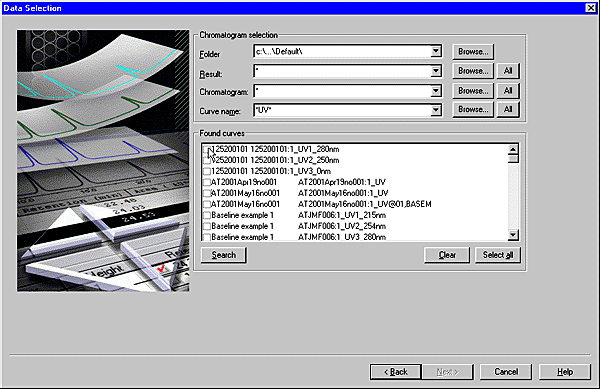
The Data Selection dialog box
|
The illustration below shows the Data
Selection dialog box.
|
|
|
|
|
Step 2: How to select data to compare
|
The table
below describes how to select data to compare:
|
Step
|
Action
|
|
1
|
-
Use the drop-down
lists and Browse buttons
in the Chromatogram selection field
to specify the result files, chromatograms and curves for comparison.
-
Click the All button
if you want to select all available results, chromatograms or curves.
|
|
2
|
Result: A list of
all curves that matched the search criteria is displayed in the Found curves field.
|
|
3
|
|
|
4
|
-
If all the
chosen curves have been integrated, go to "Step 3: How to select
the peaks" in this section.
-
If any of the chosen curves have not been integrated, the Curves not Integrated dialog box
is first displayed:
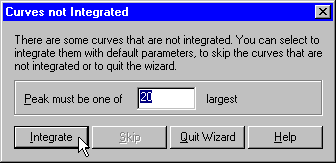
-
If desired, change
the default value for the peak number selection filter.
-
Click the Integrate button.
Result: The Peak Selection dialog box is displayed.
Note: If the results
from the automatic peak integration is not satisfactory you must
cancel the wizard and perform the integration manually. See .
|
|
|
|
|
|
The Peak Selection dialog box
|
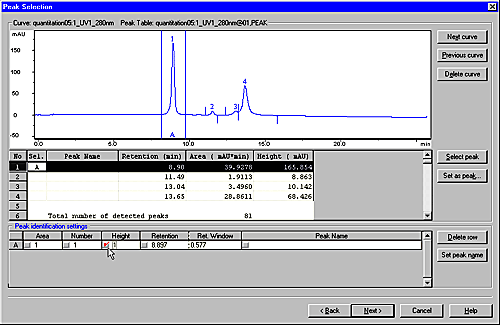
The illustration below displays the Peak
Selection dialog box:
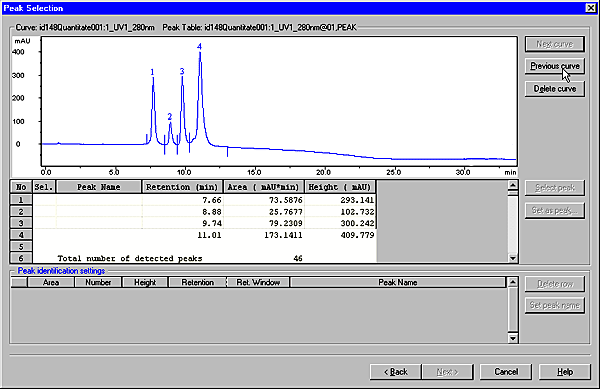
Dialog box description
The dialog box displays the following properties for the first
of the chosen curves:
|
|
|
|
|
How to adjust improper peak integrations
|
The table below describes what to do if the peaks in the curve
window do not appear to be integrated properly (for example if ghost
peaks are labelled).
|
Step
|
Action
|
|
1
|
Click the Cancel button
to quit the wizard.
|
|
2
|
Perform a peak integration (see How
to perform a peak integration) and verify that
the resulting curve is properly integrated.
|
|
3
|
Repeat the Multifile Peak
Compare wizard operation.
|
|
|
|
|
|
Step 3: How to select the peaks
|
The table below
describes how select peaks in the Peak
Selection dialog box:
|
Step
|
Action
|
|
1
|
Choose a curve in the curve window:
Result: The peak
is assigned a letter (A, B, C....) and the peak parameters are displayed
in the Peak identification settings table.
|
|
2
|
Set the desired peak identification criterion:
Example: If you
have selected the highest peak in the curve and want to compare
the highest peak among all curves, select the Height check box.
In the illustration below, the initial (A) peak and the Height check box have been selected:
|
|
3
|
If desired, you can assign a name to a chosen peak:
-
Click the name of
the row, for example A.
-
Click the Set peak
name button.
-
Type a new name and click OK.
Note: This can be
useful when you compare multiple peak parameters and you wish to
have peak names other than “Peak A”, “Peak B”, etc. to simplify
peak identification and clarity f.ex. when comparing peak data between
batch quantitated results.
|
|
4
|
Repeat steps 1-3 for other desired peaks in the current
curve.
|
|
5
|
Use the Next curve and Previous curve buttons to navigate forward
and backward among your selected curves and manually check the selections
made by the software if necessary.
|
|
6
|
Other possible actions you can perform
-
If the current curve
does not prove useful for your comparison, click the Delete curve button to delete
it from the comparison.
-
Click the Back button
to navigate back to the Data Selection dialog
box and add new curves to your comparison.
See also How to change the peak identification below.
|
|
7
|
When all peak selections and identification settings
are complete, click the Next button
to proceed to the Peak Data Selection dialog
box.
|
Note: Click and
drag in the curve window to zoom into selected peaks to simplify
accurate peak identification. Right-click and click the Reset Zoom button to reset the
zoom to the full view.
|
|
|
|
|
How to change the peak identification
|
In the Peak identification settings table,
each column identifies a peak parameter to be compared among all
peaks. If UNICORN has identified other peaks than the intended ones,
you can change the peak identification manually. The table below
describes how to change the identification:
|
If you want to...
|
then...
|
|
remove a peak identification
|
-
click the
desired peak in the curves window
-
click the Set as peak button
-
choose None in
the Set As Peak dialog box
-
click OK.
|
|
replace or add a peak identification
|
-
click a peak
in the curves window
-
click the Set as peak button
-
choose a letter in the Set
As Peak dialog box
-
click OK.
|
|
remove a row from the table
|
Note: If you click Delete row without first selecting
a row, the first row (A) is deleted by default.
|
|
|
|
|
|
Step 4: How to select the Peak Data
|
The illustration
below displays the Peak Data Selection dialog
box:
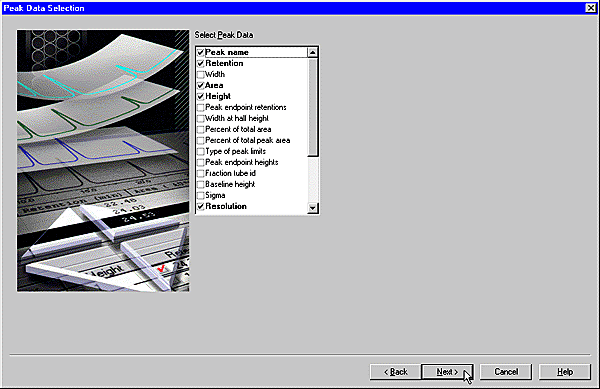
The table below describes how to select the peak data:
|
Step
|
Action
|
|
1
|
-
In the Select Peak Data list, select
the peak characteristics on the list that you want to include in
your comparisons.
-
If available, select the appropriate Scouting variables.
|
|
2
|
Note: If Media life time study was chosen
in the Operation dialog
box when the wizard was started, 2D
Plot is selected in the Data
View dialog box.
|
|
|
|
|
|
Step 5: How to use the Data View dialog box
|
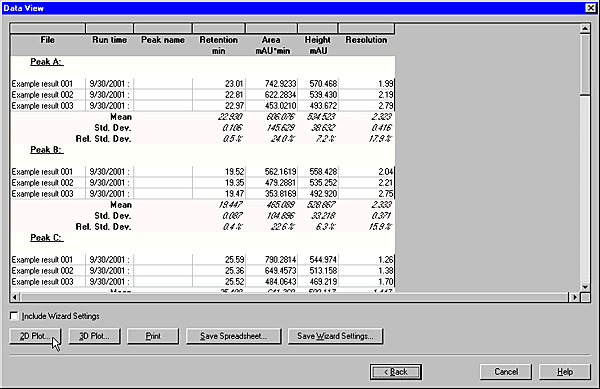
The Data View dialog box presents
a comparison of the chosen data for the designated peak comparisons.
The illustration below shows the dialog box:
The table below describes how to use the command buttons of
the dialog box:
|
Command button
|
Function
|
|
2D Plot
|
Displays the data in 2-dimensional plot. See "How to
use the 2D Data View dialog box" below.
|
|
3D Plot
|
Displays the data in 3-dimensional plot. See "How to
use the 3D Data View dialog box" below..
|
|
Print
|
Prints the spreadsheet.
|
|
Save Spreadsheet
|
Allows you to save the data in different formats:
-
Excel (.xls)
-
Tabbed text (.txt)
-
FarPoint spread (.ss3)
|
|
Save Wizard Settings
|
See "How to save the Wizard Settings" below.
|
|
Cancel
|
Ends the Multifile Peak
Compare wizard.
|
|
|
|
|
|
How to use the 2D Data View
|
The 2D Data View dialog box presents
a two-dimensional plot of a selected peak. See also "How to use
the 2D Data View shortcut menu" below. The illustration below shows
the dialog box:
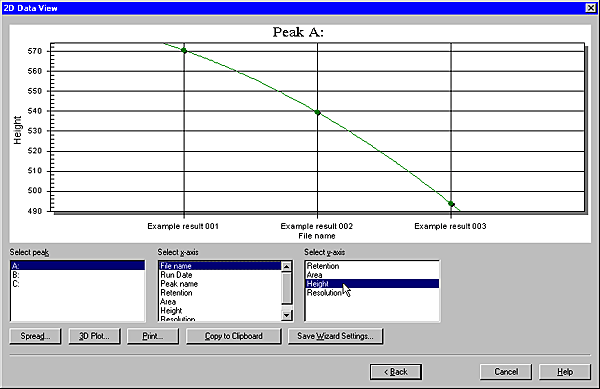
The list boxes
Use the list boxes to select which peak to plot and the units
of the x- and y-axes.
The command buttons
The table below describes how to use the command buttons of
the dialog box:
|
Command button
|
Description
|
|
Spread
|
Returns to the Data View dialog
box.
|
|
3D Plot
|
Displays the data in 3-dimensional plot. See "How to
use the 3D Data View dialog box" below.
|
|
Print
|
Prints the spreadsheet.
|
|
Copy to Clipboard
|
Stores a figure for transfer to an external program.
|
|
Save Wizard Settings
|
See "How to save the Wizard Settings" below.
|
|
Cancel
|
Ends the Multifile Peak
Compare wizard.
|
|
|
|
|
|
How to use the 2D Data View shortcut menu
|
Click the right mouse button in the plot area of the 2D Data View dialog box to open
the shortcut menu. See illustration below:
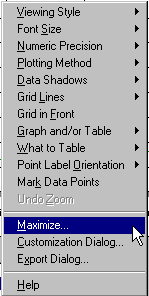
A wide array of plot presentation options can be found on
the shortcut menu. Two of them are described below:
|
|
|
|
|
How to use the 3D Data View dialog box
|
The 3D Data View dialog box presents
a three-dimensional plot of a selected peak. See also "How to use
the 3D Data View shortcut menu" below. The illustration below shows
the dialog box:
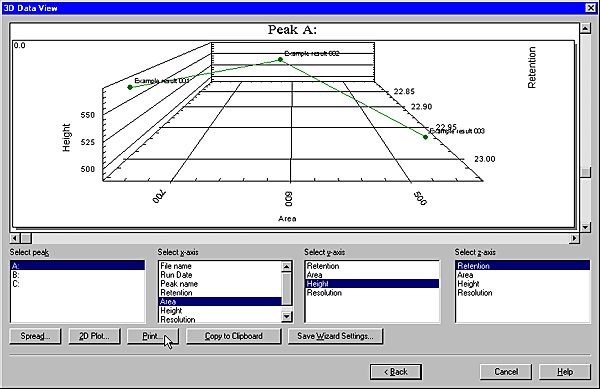
The list boxes
Use the list boxes to select which peak to plot and the units
of the x-, y- and z-axes.
The command buttons
The table below describes how to use the command buttons of
the dialog box:
|
Command button
|
Function
|
|
Spread
|
Returns to the Data View dialog
box.
|
|
2D Plot
|
Displays the data in 2-dimensional plot. See "How to
use the 2D Data View dialog box" above.
|
|
Print
|
Prints the spreadsheet.
|
|
Copy to Clipboard
|
Stores a figure for transfer to an external program.
|
|
Save Wizard Settings
|
See "How to save the Wizard Settings" below.
|
|
Cancel
|
Ends the Multifile Peak
Compare wizard.
|
|
|
|
|
|
How to use the 3D Data View shortcut menu
|
Click the right mouse button in the plot area of the 3D Data View dialog box to open
the shortcut menu. See illustration below:
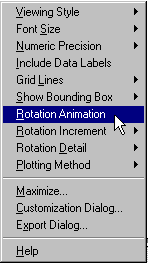
The 3D Data View shortcut
menu differs some from the 2D Data
View shortcut menu and allows the figure to be viewed
by animated rotation. The shortcut menu displays different plot
presentation options.
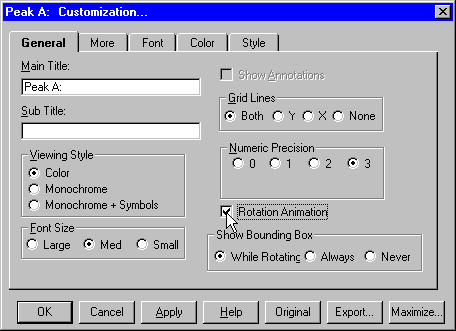
Note: You can also
click the Export button
from the Customization dialog box.
|
|
|
|
|
How to save the Wizard Settings
|
The wizard settings
can be saved from either of these dialog boxes:
The table below describes how to save the wizard settings:
|
Step
|
Action
|
|
1
|
Result: The Save Wizard Settings dialog box
opens.
|
|
2
|
Type a name in the Wizard
settings name field.
|
|
3
|
-
If the settings
are to be used by all users on the system, select the Global wizard settings check box.
-
Click OK.
-
Click Cancel to
close the wizard.
Note: The Global wizard settings check box
can also be used to toggle between lists of stored global and stored
user settings.
|
|
|
|
|
|
How to open the saved wizard settings
|
The table below
describes how to open the saved wizard settings:
|
Step
|
Action
|
|
1
|
Result: The Select Wizard Settings dialog
box opens.
|
|
2
|
Result: The Multifile Peak Compare wizard
opens with the saved settings.
Note: The Global wizard settings check box
is used to toggle between lists of stored global and stored user
settings.
|
|
|
|
|
2005-06-15
|
|
|
