How to perform a peak integration


How to perform a peak integration

The table below describes how to perform a basic peak integration.

Step

Action

1

Open a result file in the Evaluation module.

2

  • Choose Integrate:Peak Integrate.

or

  • Click the Peak Integrate toolbar icon.

Result: The Integrate dialog box opens.

3

  • Select a source curve.

  • Select a baseline or a calculation method from the Baseline list.

  • Click OK to integrate with the default selections.

or

  • Proceed with steps 4 to 6 to change the default selections.

Note: See also How to optimize the baseline with a morphological algorithm and How to optimize the baseline with a classic algorithm.

4

  • Click the Baseline settings button to change the calculation algorithm in the Settings dialog box. The default algorithm is Morphological.

  • Change the selections or values.

  • Click OK

5

  • Click the Peak window button to edit the peak window limits if necessary.

  • Click the Reject peaks button to set the parameters for peak rejection if necessary.

  • Edit the Column height or Column V values if necessary.

6

  • Click OK to integrate and close the dialog box.

or


Illustration

This is an illustration of the Integrate dialog box:


Peak integration results

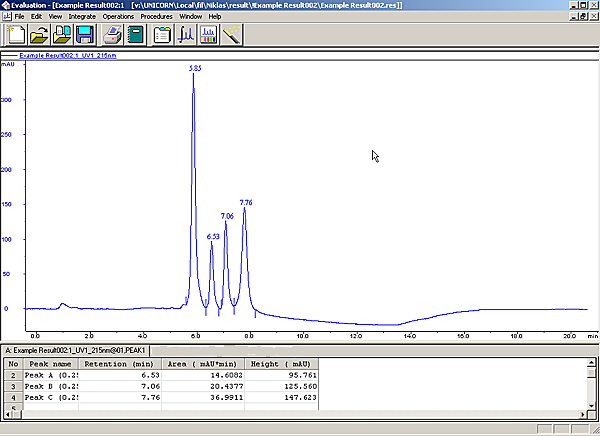
The peak table is displayed underneath the active chromatogram. The start point and end point of each peak are marked by vertical marks, drop-lines, in the chromatogram. 
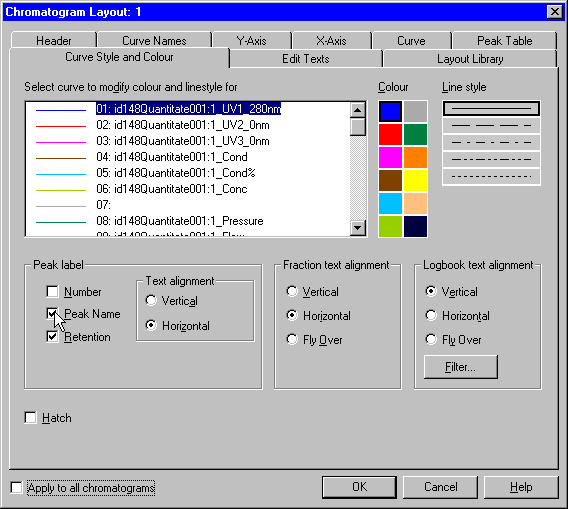
The peaks are automatically labelled according to what is selected in the Curve Style and Color tab of the Chromatogram Layout dialog box.

This is an illustration of the results after a peak integration:

Note: Peak tables can be copied from one chromatogram to another with the Edit:Copy command. However, to display the table you must right-click in the chromatogram, choose Properties and then select the new peak table on the Peak Table tab of the Chromatogram Layout dialog box.


How to display peak characteristics

The peak retention times and several other peak characteristics are calculated automatically. The table below describes how to display other peak characteristics.

Step

Action

1

  • Right-click in the active chromatogram.

  • Select Properties from the shortcut menu.

Result: The Chromatogram Layout dialog box opens.

2

Click the Peak Table tab.

3

  • Select options from the Select peak table columns list.

  • Click OK.

Result: The selected items will be displayed in the peak table.


How to filter peaks from view

Peaks can be removed from display in a peak table. The table below describes how to filter the peaks:

Step

Action

1

  • Right-click in the active chromatogram or peak table.

  • Select Properties from the shortcut menu.

Result: The Chromatogram Layout dialog box opens.

2

Click the Peak Table tab.

3

  • Click the check boxes in the Filter Peaks field to select the filter criteria.

  • Specify filter values.

  • Click OK.


To filter peaks vs. to reject peaks

The table below describes the major differences in the effect of filtering peaks compared to excluding the peaks by rejection.

Filter peaks...

Reject peaks...

excludes the peaks from display,

permanently excludes peaks from the integration,

does not exclude the peaks from the calculation of the total peak area,

excludes the peaks from the calculation of the total peak area,

can be reversed.

cannot be reversed.


Peak labels

Peaks can be labelled with their retention, sequentially numbered, or be marked with specific identification names. See table below for an instruction on how to display peak labels.

The label type can be selected on the Curve Style and Colour tab in the Chromatogram Layout dialog box. De-select all label options to hide the labels, e.g. for presentations.

The illustration below shows the Chromatogram Layout dialog box with the Curve Style and Colour tab opened:


How to display peak labels

The table below describes how to display peak labels:

Step

Action

1

  • Choose Edit:Chromatogram Layout.

or

  • Click the Chromatogram Layout icon.

Result: The Chromatogram Layout dialog box opens.

2

Click the Curve Style and Colour tab.

3

Select one or more of the following labelling options in the Peak label field:

  • Number

Result: The peaks will be numbered sequentially.

  • Peak Name

Result: Peak names will be displayed. See How to edit the peaks for information about how to name the peaks.

  • Retention

Result: The retention volume or time will be displayed.

  • Click OK.


2005-06-15