How to edit the peaks


Introduction

Once a peak table has been generated based on an appropriate baseline, it is possible to split or join peaks and to manually adjust the peak start and end points. The peaks will then be renumbered and the peak values will all be recalculated.


How to open the peak table for editing

The table below describes how open the peak table for editing. The editing options are described below this table:

Step

Action

1

  • Select Integrate:Edit Peak Table.

Result: If there are more than one peak table available, the Select Peak Table to Edit dialog box opens. The name of the baseline on which the peak table was based is displayed at the bottom of the panel.

2

  • Select the peak table from the list and click OK.

  • Select one or more Help Curves to be displayed for reference if necessary.

Result: The Edit Peak Table dialog box opens.

Note: The Edit Peak Table dialog box will be opened immediately if you select Save and Edit Peak Table as the last step of the peak integration.

3

Perform the changes (described in the instructions below).

4

Click OK.

Result: The Save Edited Peak Table dialog box opens. The dialog box displays a suggested name and location for the peak table.

5

Confirm the name and location and click OK.


How to adjust the baseline

The baseline can be adjusted graphically (see also How to edit the baseline manually) in the Edit Peak Table dialog box. The table below describes this:

Step

Action

1

  • Click the Set Curve Points icon.

Result: The cursor is changed into a cross.

2

Perform the operations below as desired:

  • Click to insert a new data point.

  • Double-click on a data point or right-click the point and select Delete Point from the short-cut menu to delete the point.

  • Click a data point and drag the point to a new position to move the baseline.

Note: Accept negative peaks must be selected before the peak integration if you want to be able to drag a data point to move the baseline above the curve.


How to calculate a new baseline

The baseline can be recalculated in the Edit Peak Table dialog box. The table below describes how to do this:

Step

Action

1

  • Select Baseline:New:Calculate.

or

  • Right-click and select New Calculate from the shortcut menu.

Result: The Settings dialog box opens.

2

  • Select an algorithm (Morphological is default).

3

  • Adjust the Baseline parameters as desired.

or

  • Click the Default Values button for the default values.

4

  • Click OK.

Result: The baseline is recalculated.

Note: Select Baseline:New:Zero Baseline to replace the calculated baseline with a zero baseline.


The Edit Peak Table dialog box

The illustration below shows the Edit Peak Table dialog box.


How to delete a peak

The table below describes how to delete a peak in the Edit Peak Table dialog box:

Step

Action

1

  • Click the Edit peaks icon.

  • Click the peak in the curve or in the peak table to select the peak.

2

  • Right-click and select Delete Peaks from the shortcut menu.

or

  • Select Edit:Delete Peaks.

Result: The peak is deleted and the remaining peaks are renumbered.


How to add color to a peak

The table below describes how to add a fill color and a pattern to a peak in the Edit Peak Table dialog box:

Step

Action

1

  • Click the Edit peaks icon.

  • Move the cursor over the peak you want to edit.

Result: The cursor is changed into a larger arrow.

  • Click to select the peak.

2

  • Right-click and select Fill Peak from the shortcut menu.

or

  • Select Edit:Fill Peak.

Result: The Color and Pattern dialog box opens.

  • Select a color and a pattern.

  • Click OK.

Result: The peak is filled according to the selections.

Note: The color and pattern selections will override the general Fill settings that can be selected for all peaks on the Peak Table tab in the Chromatogram Layout dialog box.


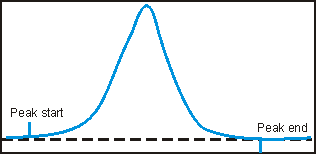
Peak start and end points

The beginning of each peak is marked with a drop-line above the curve, and the end of each peak is marked with a drop-line below the curve. The illustration below shows an example of start and end point drop-lines:

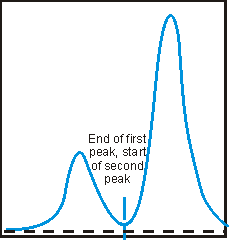
Where there are two peaks beside one another, the end of the first peak will be at the same point as the beginning of the next peak. Thus, there will be a drop-line below and above the curve at the same point. See the illustration below:


How to split a peak

It is possible to split the peak into two new peaks by inserting a drop-line. The table below describes how to split a peak in the Edit Peak Table dialog box:

Step

Action

1

  • Click the Edit peaks icon.

  • Click the peak in the curve or in the peak table to select the peak.

2

  • Right-click and select Split Peak from the shortcut menu.

or

  • Select Edit:Split Peaks.

Result: A new drop-line is inserted at the middle point between the two existing drop-lines and the peak is split.

Note: The area under each new peak will not be the same if the symmetry of the original peak was not perfect.


How to join peaks

It is possible to join the areas of adjacent peaks if they are separated by a drop-line. The table below describes how to join adjacent peaks in the Edit Peak Table dialog box:

Step

Action

1

  • Click the Edit peaks icon.

  • Click the peak in the curve or in the peak table to select the peak.

2

  • Right-click and select Join Left or Join Right from the shortcut menu.

or

  • Select Edit:Join Left or Edit:Join Right.

Result: The original intervening drop-line is removed and all peaks are renumbered.


How to add peak names

The table below describes how to add names in the Edit Peak Table dialog box to identify the peaks:

Step

Action

1

  • Click the Edit peaks icon.

  • Click the peak in the curve or in the peak table to select the peak.

2

  • Right-click and select Peak Name from the shortcut menu.

or

  • Choose Edit:Peak name.

or

  • Double-click the peak in the peak table or the curve.

Result: The Edit Peak Name dialog box opens. The number and retention of the selected peak is displayed.

3

Type a name in the Peak name textbox and click OK.


How to adjust peak areas with drop-lines

The table below describes how to move the drop-lines to adjust the peak area in the Edit Peak Table dialog box.

Step

Action

1

  • Click the Edit peaks icon.

  • Click the peak in the curve or in the peak table to select the peak.

Result: Two vertical bars become superimposed over the drop-lines that delimit the selected peak. The area between the bars is filled with a yellow fill pattern.

2

Drag the bars to define the new limits for the selected peak.

Result: The drop-lines are moved and the peak areas are automatically recalculated.

Note: A drop-line can never be moved beyond another drop-line or beyond a point where the peak meets the baseline.


How to use the zoom function

The table below describes how to use the zoom function in the Edit Peak Table dialog box.

Step

Action

1

  • Click the Zoom icon.

Result: The cursor is changed into a magnifying glass.

2

  • Press and hold the left mouse button.

  • Drag the cursor over the area you want to zoom in on.

  • Release the mouse button.

Result: The area is enlarged. Right-click and select Reset zoom to restore the full view.


The Integrate menu

If needed you can use the selections on the Integrate menu to perform a peak integration in the Edit Peak Table dialog box. This is useful for example if you want to re-integrate the curve using different settings or integrate only part of a curve with different settings.

See How to integrate part of a curve and how to exclude or skim peaks for more information.


2005-06-15