

|
|
|
|
|
The chromatogram window
|

|
|
Main views

|
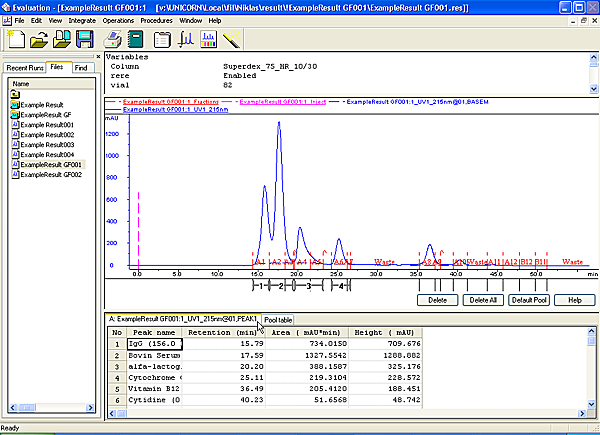
The
chromatogram window is divided into four main
views:
-
File Navigator
-
header
information
-
curves
-
peak and pool tables
The displayed areas for the views can be adjusted by dragging
the borders with the mouse cursor between the views.
The picture below
shows an example of the window with all views present:
|
|
|
|
|
How to view header information
|
You
can display header information at the top of a chromatogram, with
details on variables, scouting variables, questions and/or notes.
Header information cannot be displayed for imported chromatograms.
The table below describes how to display header information:
|
Step
|
Action
|
|
1
|
Open a result file.
|
|
2
|
In the Evaluation module,
select Edit:Chromatogram Layout...
Result: The Chromatogram Layout dialog box
is displayed.
|
|
3
|
|
|
4
|
-
In the chromatogram
window, place the cursor at the top of the curve window (just below
the toolbar) until the window sizing tool appears.
-
Drag the cursor down to display the header window.
|
|
|
|
|
|
How to view peak table information
|
The
table below describes how to display peak table information if the
result has been integrated:
|
Step
|
Action
|
|
1
|
Open a result file.
|
|
2
|
|
|
3
|
-
Click the Peak Table tab.
-
Select a peak table in the Select
peak table to display list.
-
Select what peak table columns to display.
-
Check if global peak table data should be displayed
or not.
-
Click OK.
|
|
|
|
|
|
How to view the Pool table
|
If fractions are pooled, the Pool Table is
displayed in the same pane as the Peak Table.
See How to
pool fractions for more information on how to
create the Pool Table.
|
|
|
|
|
Run curves, default appearance and information
|
The
first time a result file is opened and viewed, a default layout
is applied to display all the original curves. The default layout
can be changed by the user (see How
to save and apply a layout).
Information for each curve
Each curve is automatically assigned a default color and style,
with default information about each curve displayed in the key above
the curves. This information includes
-
result file name
-
chromatogram name
-
curve name.
Choose the Y-axis scale
Each
curve has a correspondingly colored Y-axis. To choose the appropriate
Y-axis scale
or
|
|
|
|
|
Run curves, shortcut menu
|
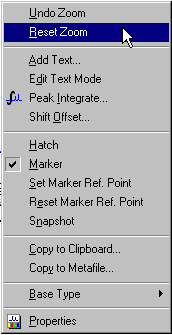
When
viewing curves in the Evaluation module,
you can access a menu that provides a quick alternative to menu
commands. Right-click the run curves view to display the menu shown
in the picture below:
|
|
|
|
|
Optimizing the workspace
|
The
chromatogram window can be minimized and maximized using ordinary Windows
commands. The table below describes extra features to optimize the workspace:
|
Use the command
|
if you want...
|
|
Window:Arrange icons
|
to arrange icons of minimized windows.
|
|
Window:Tile
|
to view several chromatogram windows side by side.
|
|
Window:Cascade
|
to stack the open windows like a deck of cards.
|
|
|
|
|
|
How to display a vertical marker line
|
The table
below describes how to display a vertical marker line:
|
Step
|
Action
|
|
1
|
Right-click the Curves pane
and select Marker.
|
|
2
|
Drag the marker line with the mouse.
Result: Where the
line bisects the curve, the X-axis and Y-axis values are displayed
at the top right corner of the pane.
|
Note: Right-click
and select Snapshot to record
the marker position values. See Snapshots for
more information about the Snapshot function.
|
|
|
|
|
How to set a reference point
|
The table
describes how to set a reference point:
|
Step
|
Action
|
|
1
|
|
|
2
|
When the marker is moved from the reference point,
the X-axis and Y-axis values for the new position are displayed
together with:
-
the new position
in relation to the reference point,
-
the minimum, maximum and average values for the
curve interval between the reference point and the new position.
|
|
|
|
|
|
How to display the logbook overlay
|
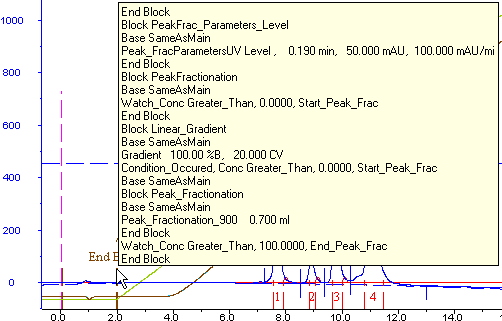
The
table below describes how to display the logbook entries as an overlay
in the chromatogram.
|
Step
|
Action
|
|
1
|
Result: The Chromatogram Layout dialog box
opens.
|
|
2
|
|
|
3
|
Result: The Filter Logbook dialog box opens.
|
|
4
|
Result: The selected
logbook items are displayed in the chromatogram window.
|
How to view the complete logbook information
At some breakpoints there can be more logbook information
than what is possible to conveniently display in the chromatogram
window. The additional information that is not displayed is indicated
by an arrow point symbol by the break point.
|
|
|
|
2005-06-15
|
|
|